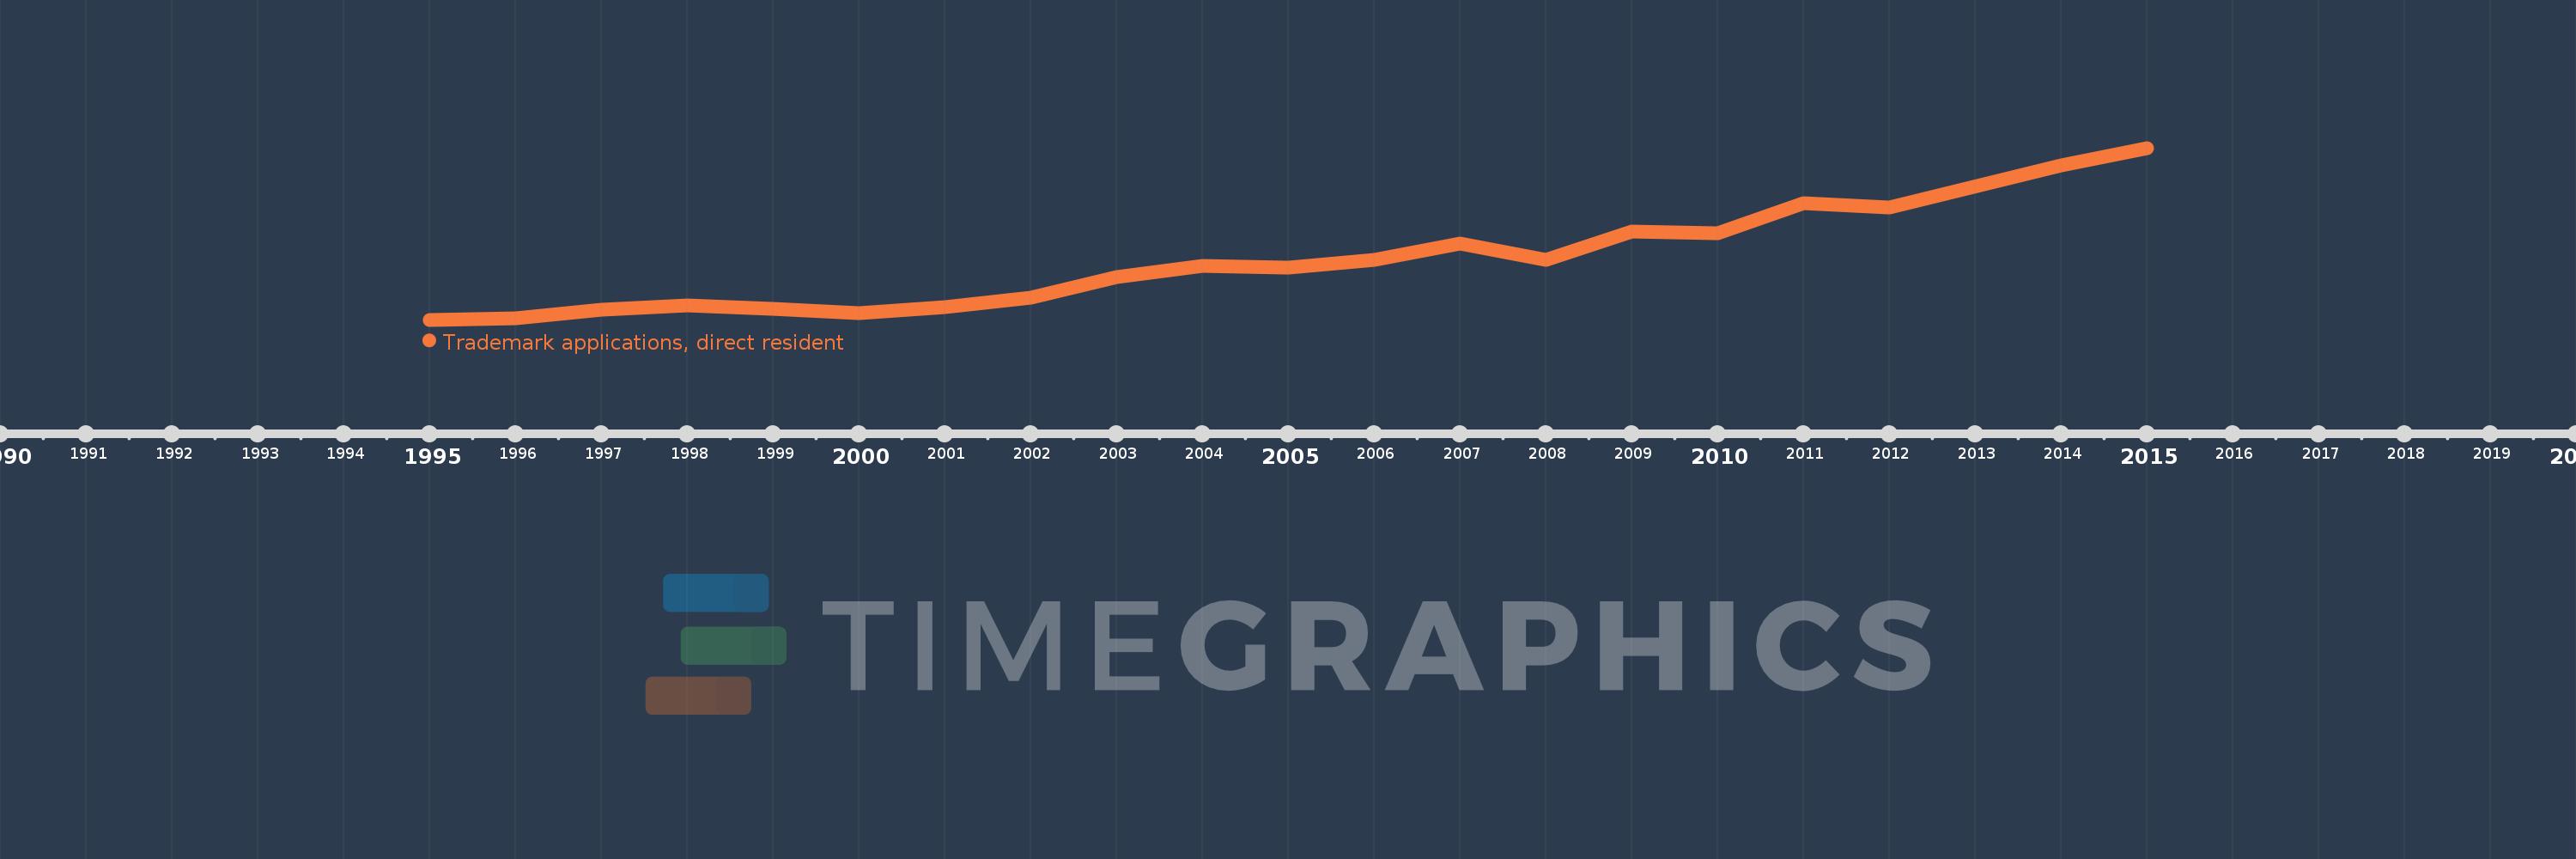
This timeline shows a graph from 1995 to 2015 of Albania. No data until 1994. Number of actual observations by date: 20.
Source name:
World Development Indicators
Source organization:
World Intellectual Property Organization (WIPO), WIPO Patent Report: Statistics on Worldwide Patent Activity. The International Bureau of WIPO assumes no responsibility with respect to the transformation of these data.
Categories, topics:
Science & Technology
Last updated:
apr 23, 2017
Indicators value changes by year
Meaning:
141.5
Minimum:
1.0
jan 1, 1995
Maximum:
420.0
jan 1, 2015
At the date of observation
Value
Absolute change
Change from the previous value
jan 1, 1995
1.0
+1.0
0.0%
jan 1, 1996
4.0
+3.0
300.0%
jan 1, 1997
26.0
+22.0
550.0%
jan 1, 1998
36.0
+10.0
38.46%
jan 1, 1999
27.0
-9.0
-25.0%
jan 1, 2000
17.0
-10.0
-37.04%
jan 1, 2001
32.0
+15.0
88.24%
jan 1, 2002
54.0
+22.0
68.75%
jan 1, 2003
106.0
+52.0
96.3%
jan 1, 2004
132.0
+26.0
24.53%
jan 1, 2005
128.0
-4.0
-3.03%
jan 1, 2006
147.0
+19.0
14.84%
jan 1, 2007
186.0
+39.0
26.53%
jan 1, 2008
148.0
-38.0
-20.43%
jan 1, 2009
216.0
+68.0
45.95%
jan 1, 2010
213.0
-3.0
-1.39%
jan 1, 2011
286.0
+73.0
34.27%
jan 1, 2012
274.0
-12.0
-4.2%
jan 1, 2014
377.0
+103.0
37.59%
jan 1, 2015
420.0
+43.0
11.41%
Ranking of countries by current statistics by years