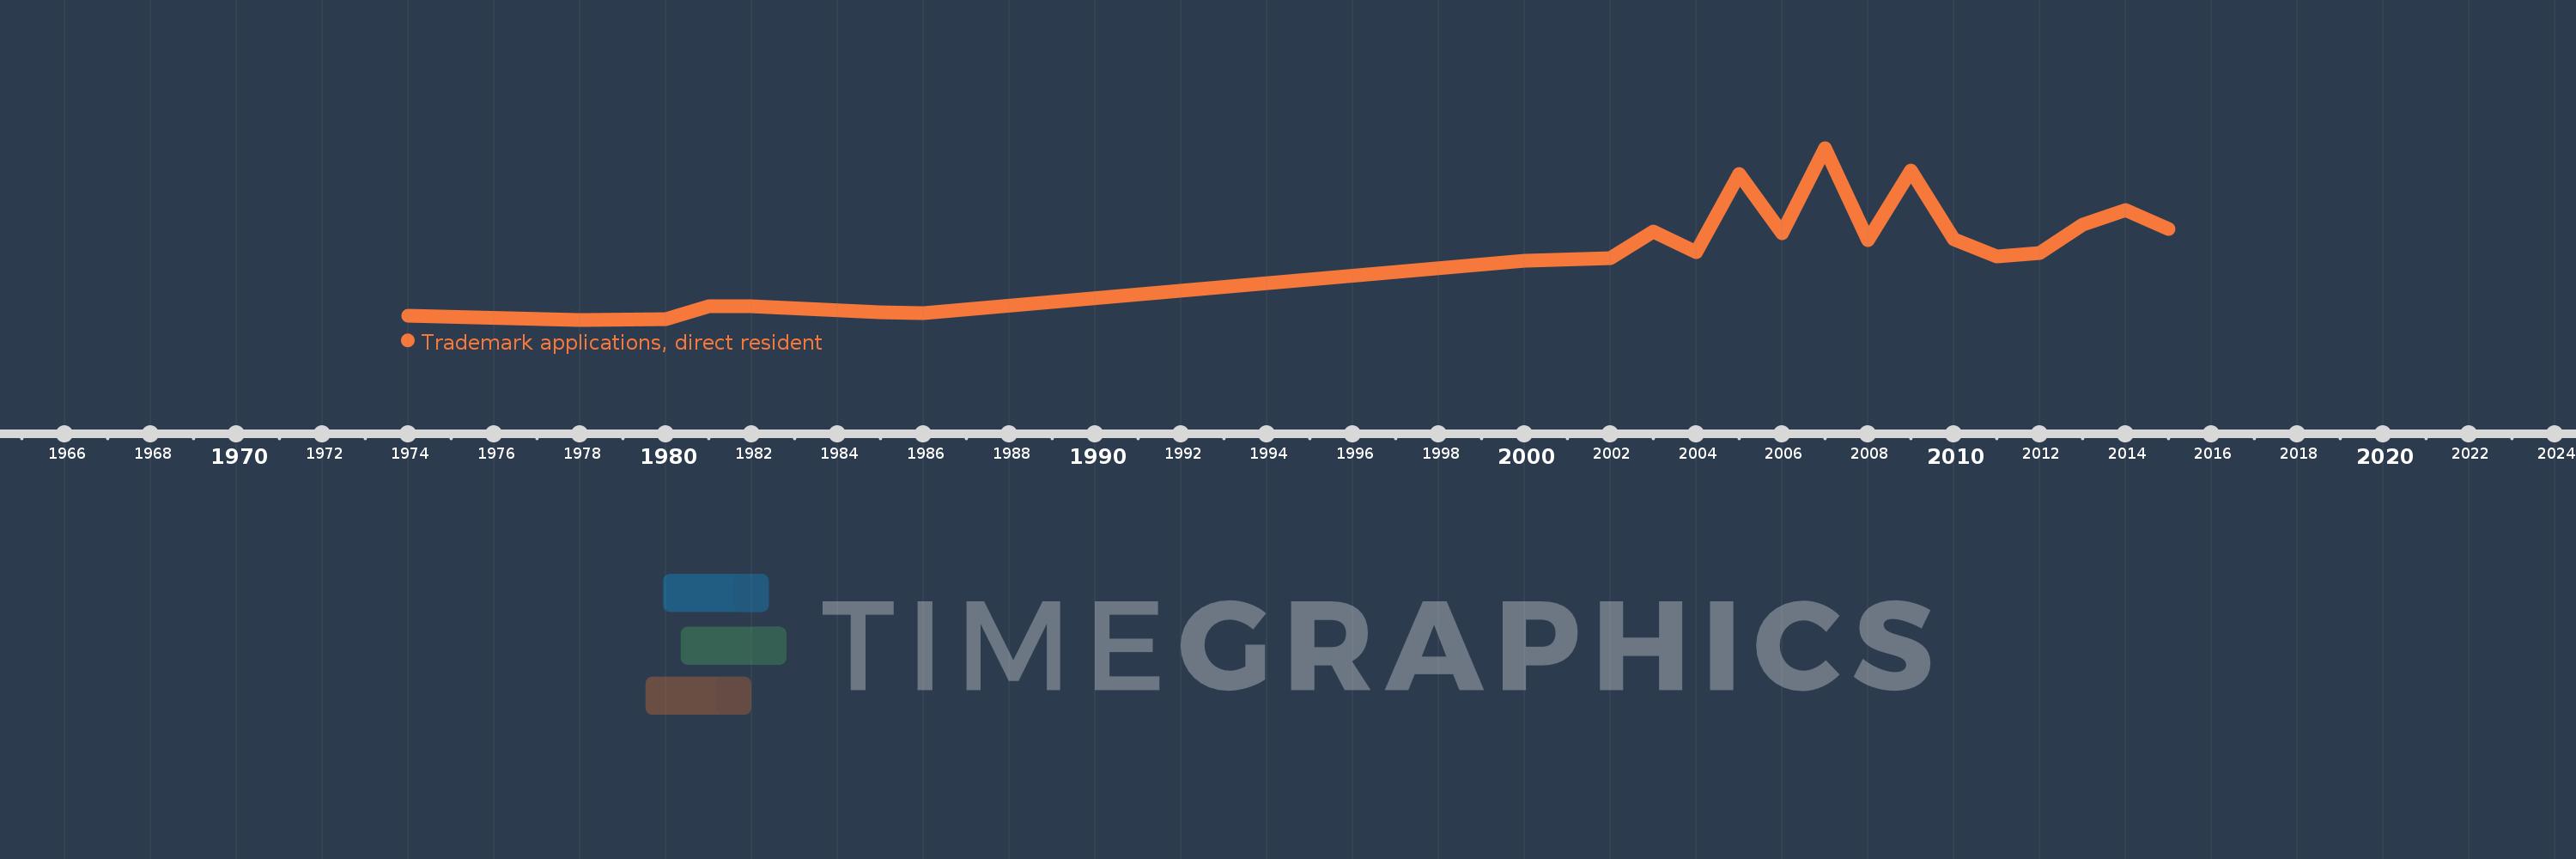
This timeline shows a graph from 1974 to 2015 of Barbados. No data until 1973. Number of actual observations by date: 22.
Source name:
World Development Indicators
Source organization:
World Intellectual Property Organization (WIPO), WIPO Patent Report: Statistics on Worldwide Patent Activity. The International Bureau of WIPO assumes no responsibility with respect to the transformation of these data.
Categories, topics:
Science & Technology
Last updated:
apr 23, 2017
Indicators value changes by year
Meaning:
141.455
Minimum:
17.0
jan 1, 1978
Maximum:
339.0
jan 1, 2007
At the date of observation
Value
Absolute change
Change from the previous value
jan 1, 1974
24.0
+24.0
0.0%
jan 1, 1978
17.0
-7.0
-29.17%
jan 1, 1980
18.0
+1.0
5.88%
jan 1, 1981
43.0
+25.0
138.89%
jan 1, 1982
42.0
-1.0
-2.33%
jan 1, 1985
31.0
-11.0
-26.19%
jan 1, 1986
29.0
-2.0
-6.45%
jan 1, 2000
127.0
+98.0
337.93%
jan 1, 2002
132.0
+5.0
3.94%
jan 1, 2003
183.0
+51.0
38.64%
jan 1, 2004
143.0
-40.0
-21.86%
jan 1, 2005
291.0
+148.0
103.5%
jan 1, 2006
179.0
-112.0
-38.49%
jan 1, 2007
339.0
+160.0
89.39%
jan 1, 2008
167.0
-172.0
-50.74%
jan 1, 2009
297.0
+130.0
77.84%
jan 1, 2010
168.0
-129.0
-43.43%
jan 1, 2011
135.0
-33.0
-19.64%
jan 1, 2012
142.0
+7.0
5.19%
jan 1, 2013
196.0
+54.0
38.03%
jan 1, 2014
222.0
+26.0
13.27%
jan 1, 2015
187.0
-35.0
-15.77%
Ranking of countries by current statistics by years