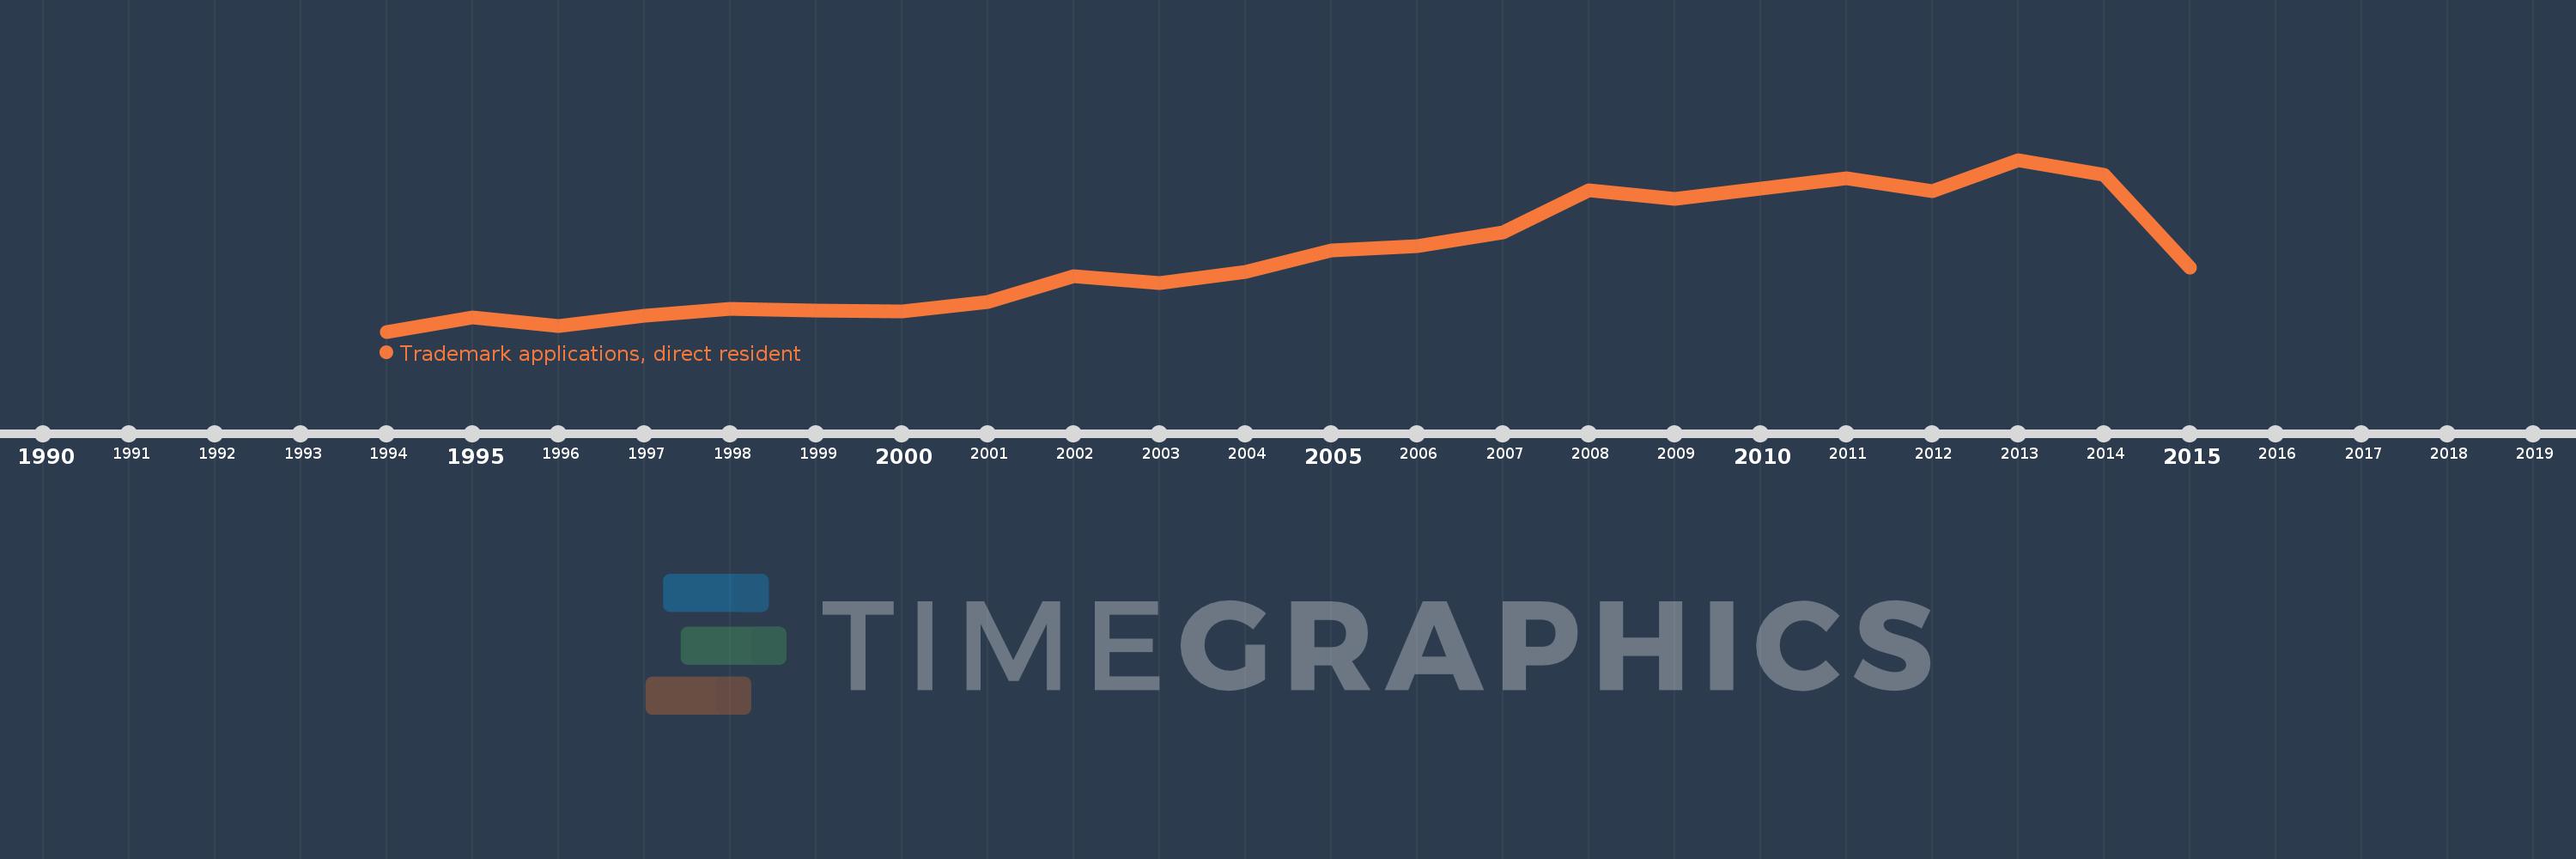
This timeline shows a graph from 1994 to 2015 of Belarus. No data until 1993. Number of actual observations by date: 22.
Source name:
World Development Indicators
Source organization:
World Intellectual Property Organization (WIPO), WIPO Patent Report: Statistics on Worldwide Patent Activity. The International Bureau of WIPO assumes no responsibility with respect to the transformation of these data.
Categories, topics:
Science & Technology
Last updated:
apr 23, 2017
Indicators value changes by year
Meaning:
2.301K
Minimum:
729.0
jan 1, 1994
Maximum:
4.302K
jan 1, 2013
At the date of observation
Value
Absolute change
Change from the previous value
jan 1, 1994
729.0
+729.0
0.0%
jan 1, 1995
1.032K
+303.0
41.56%
jan 1, 1996
844.0
-188.0
-18.22%
jan 1, 1997
1.068K
+224.0
26.54%
jan 1, 1998
1.209K
+141.0
13.2%
jan 1, 1999
1.173K
-36.0
-2.98%
jan 1, 2000
1.15K
-23.0
-1.96%
jan 1, 2001
1.344K
+194.0
16.87%
jan 1, 2002
1.885K
+541.0
40.25%
jan 1, 2003
1.733K
-152.0
-8.06%
jan 1, 2004
1.972K
+239.0
13.79%
jan 1, 2005
2.41K
+438.0
22.21%
jan 1, 2006
2.51K
+100.0
4.15%
jan 1, 2007
2.797K
+287.0
11.43%
jan 1, 2008
3.666K
+869.0
31.07%
jan 1, 2009
3.487K
-179.0
-4.88%
jan 1, 2010
3.703K
+216.0
6.19%
jan 1, 2011
3.921K
+218.0
5.89%
jan 1, 2012
3.649K
-272.0
-6.94%
jan 1, 2013
4.302K
+653.0
17.9%
jan 1, 2014
3.988K
-314.0
-7.3%
jan 1, 2015
2.055K
-1.933K
-48.47%
Ranking of countries by current statistics by years