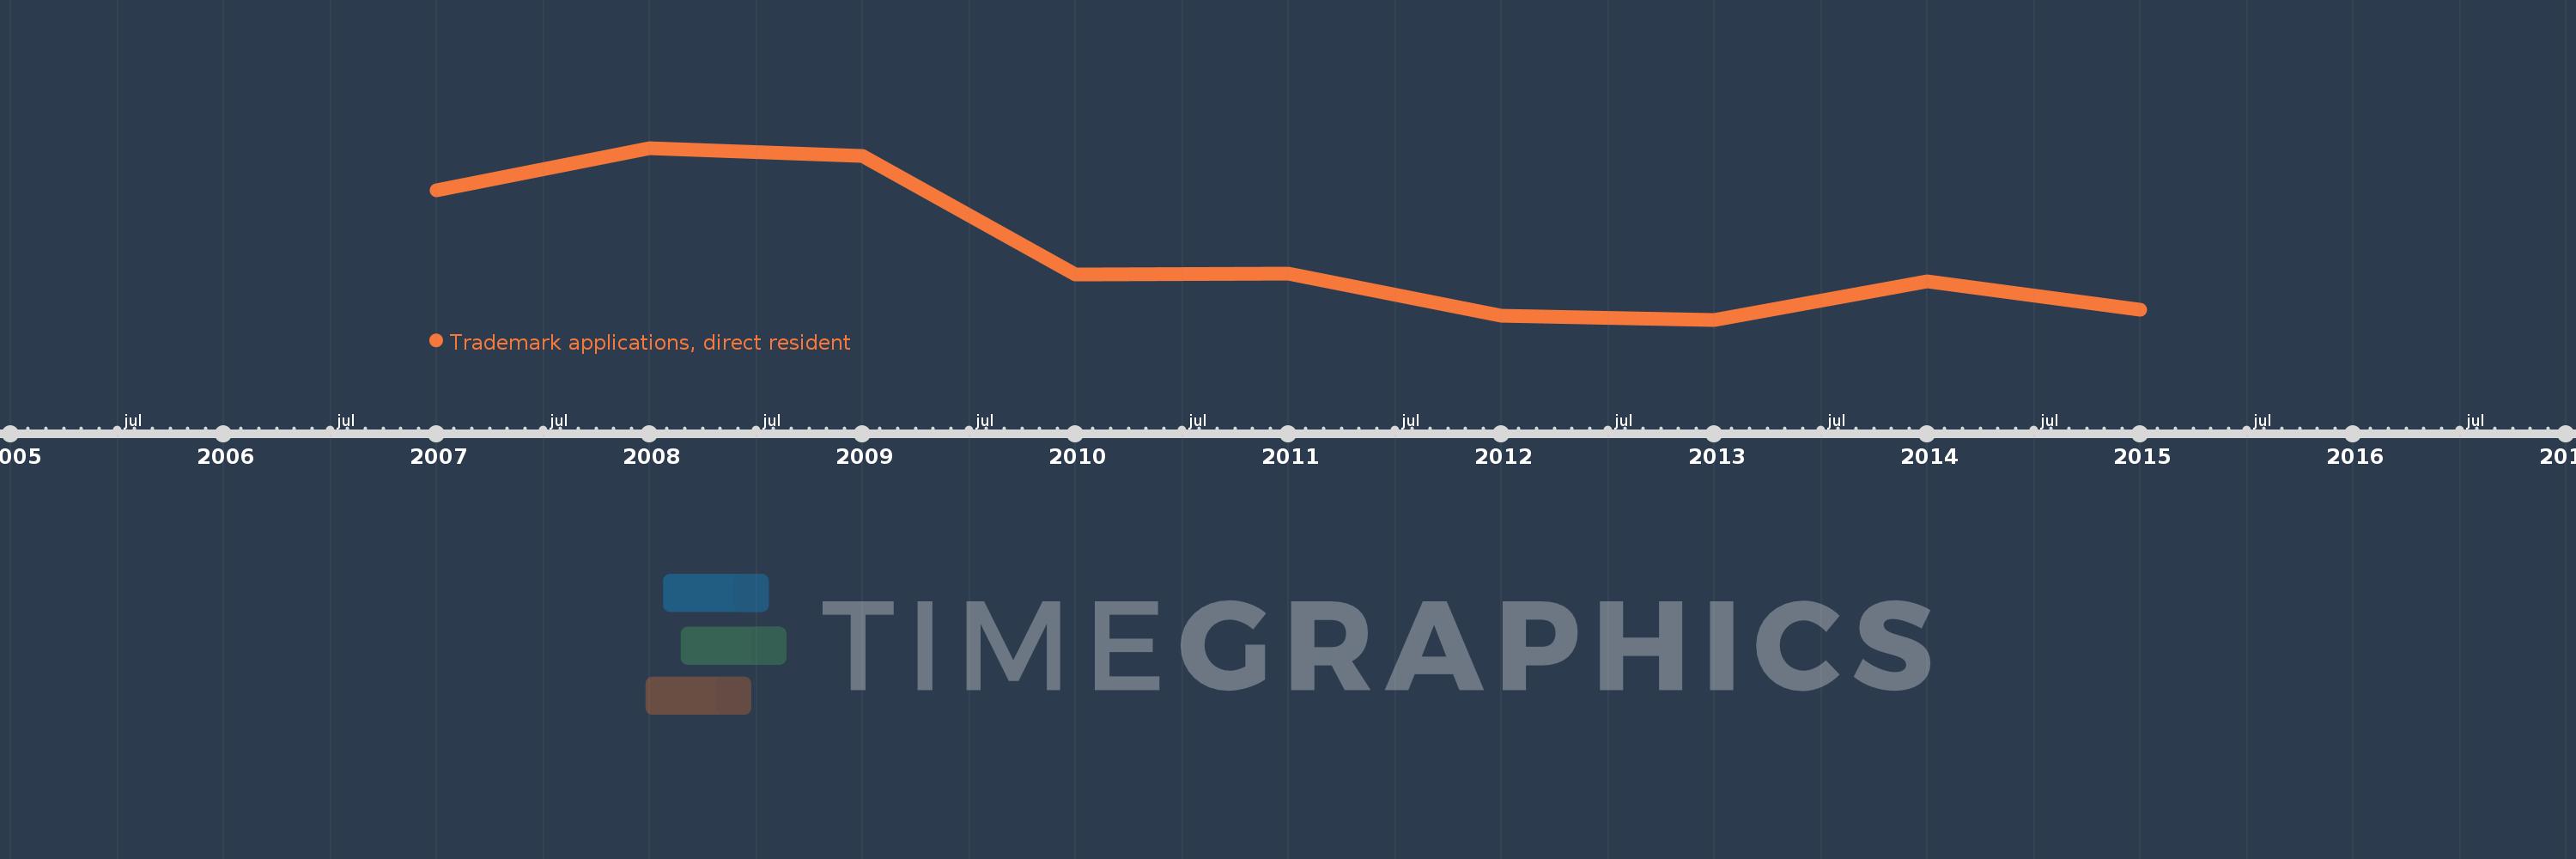
This timeline shows a graph from 2007 to 2015 of Serbia. No data until 2006. Number of actual observations by date: 9.
Source name:
World Development Indicators
Source organization:
World Intellectual Property Organization (WIPO), WIPO Patent Report: Statistics on Worldwide Patent Activity. The International Bureau of WIPO assumes no responsibility with respect to the transformation of these data.
Categories, topics:
Science & Technology
Last updated:
apr 23, 2017
Indicators value changes by year
Meaning:
1.502K
Minimum:
1.112K
jan 1, 2013
Maximum:
2.102K
jan 1, 2008
At the date of observation
Value
Absolute change
Change from the previous value
jan 1, 2007
1.858K
+1.858K
0.0%
jan 1, 2008
2.102K
+244.0
13.13%
jan 1, 2009
2.054K
-48.0
-2.28%
jan 1, 2010
1.373K
-681.0
-33.15%
jan 1, 2011
1.38K
+7.0
0.51%
jan 1, 2012
1.133K
-247.0
-17.9%
jan 1, 2013
1.112K
-21.0
-1.85%
jan 1, 2014
1.335K
+223.0
20.05%
jan 1, 2015
1.17K
-165.0
-12.36%
Ranking of countries by current statistics by years