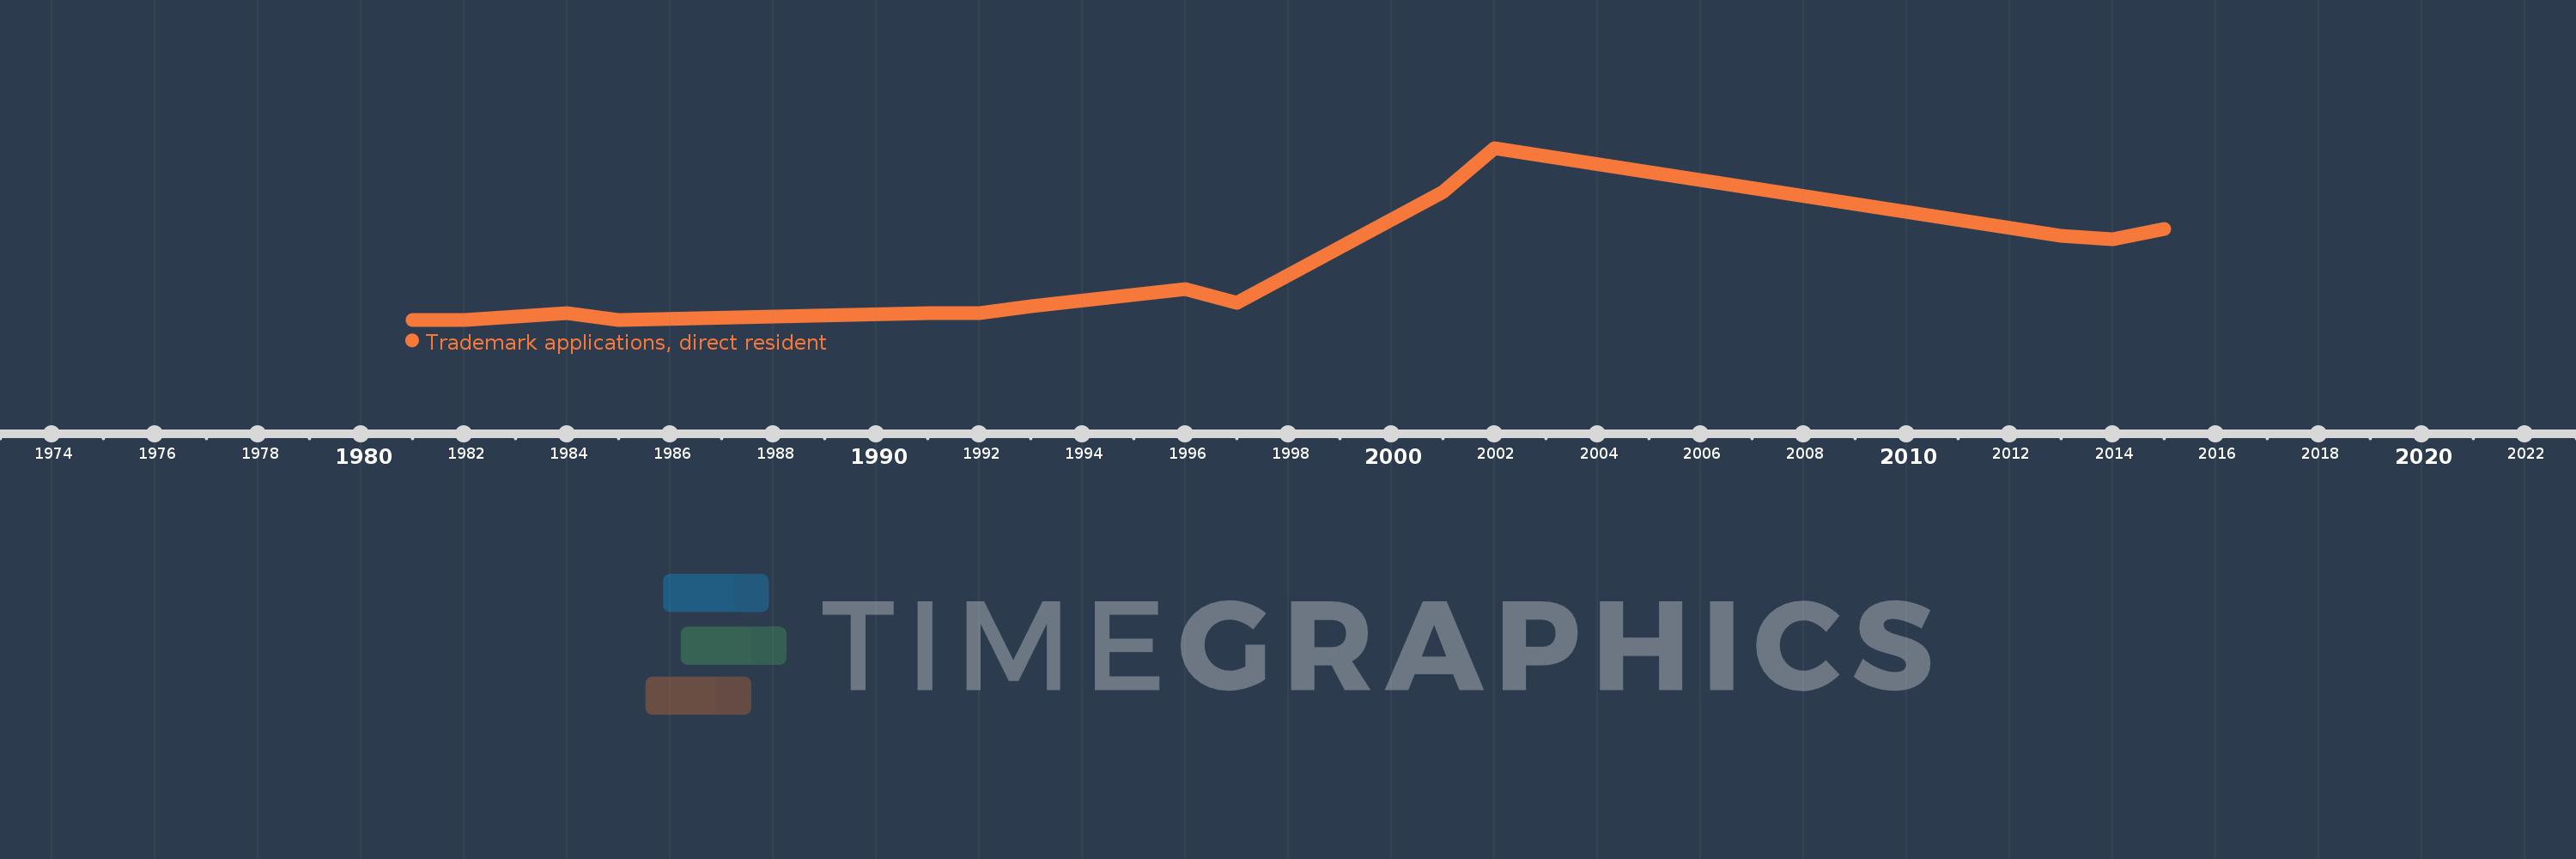
This timeline shows a graph from 1981 to 2015 of St. Lucia. No data until 1980. Number of actual observations by date: 14.
Source name:
World Development Indicators
Source organization:
World Intellectual Property Organization (WIPO), WIPO Patent Report: Statistics on Worldwide Patent Activity. The International Bureau of WIPO assumes no responsibility with respect to the transformation of these data.
Categories, topics:
Science & Technology
Last updated:
apr 23, 2017
Indicators value changes by year
Meaning:
16.5
Minimum:
3.0
jan 1, 1981
Maximum:
54.0
jan 1, 2002
At the date of observation
Value
Absolute change
Change from the previous value
jan 1, 1981
3.0
+3.0
0.0%
jan 1, 1982
3.0
0.0
0.0%
jan 1, 1984
5.0
+2.0
66.67%
jan 1, 1985
3.0
-2.0
-40.0%
jan 1, 1991
5.0
+2.0
66.67%
jan 1, 1992
5.0
0.0
0.0%
jan 1, 1993
7.0
+2.0
40.0%
jan 1, 1996
12.0
+5.0
71.43%
jan 1, 1997
8.0
-4.0
-33.33%
jan 1, 2001
41.0
+33.0
412.5%
jan 1, 2002
54.0
+13.0
31.71%
jan 1, 2013
28.0
-26.0
-48.15%
jan 1, 2014
27.0
-1.0
-3.57%
jan 1, 2015
30.0
+3.0
11.11%
Ranking of countries by current statistics by years