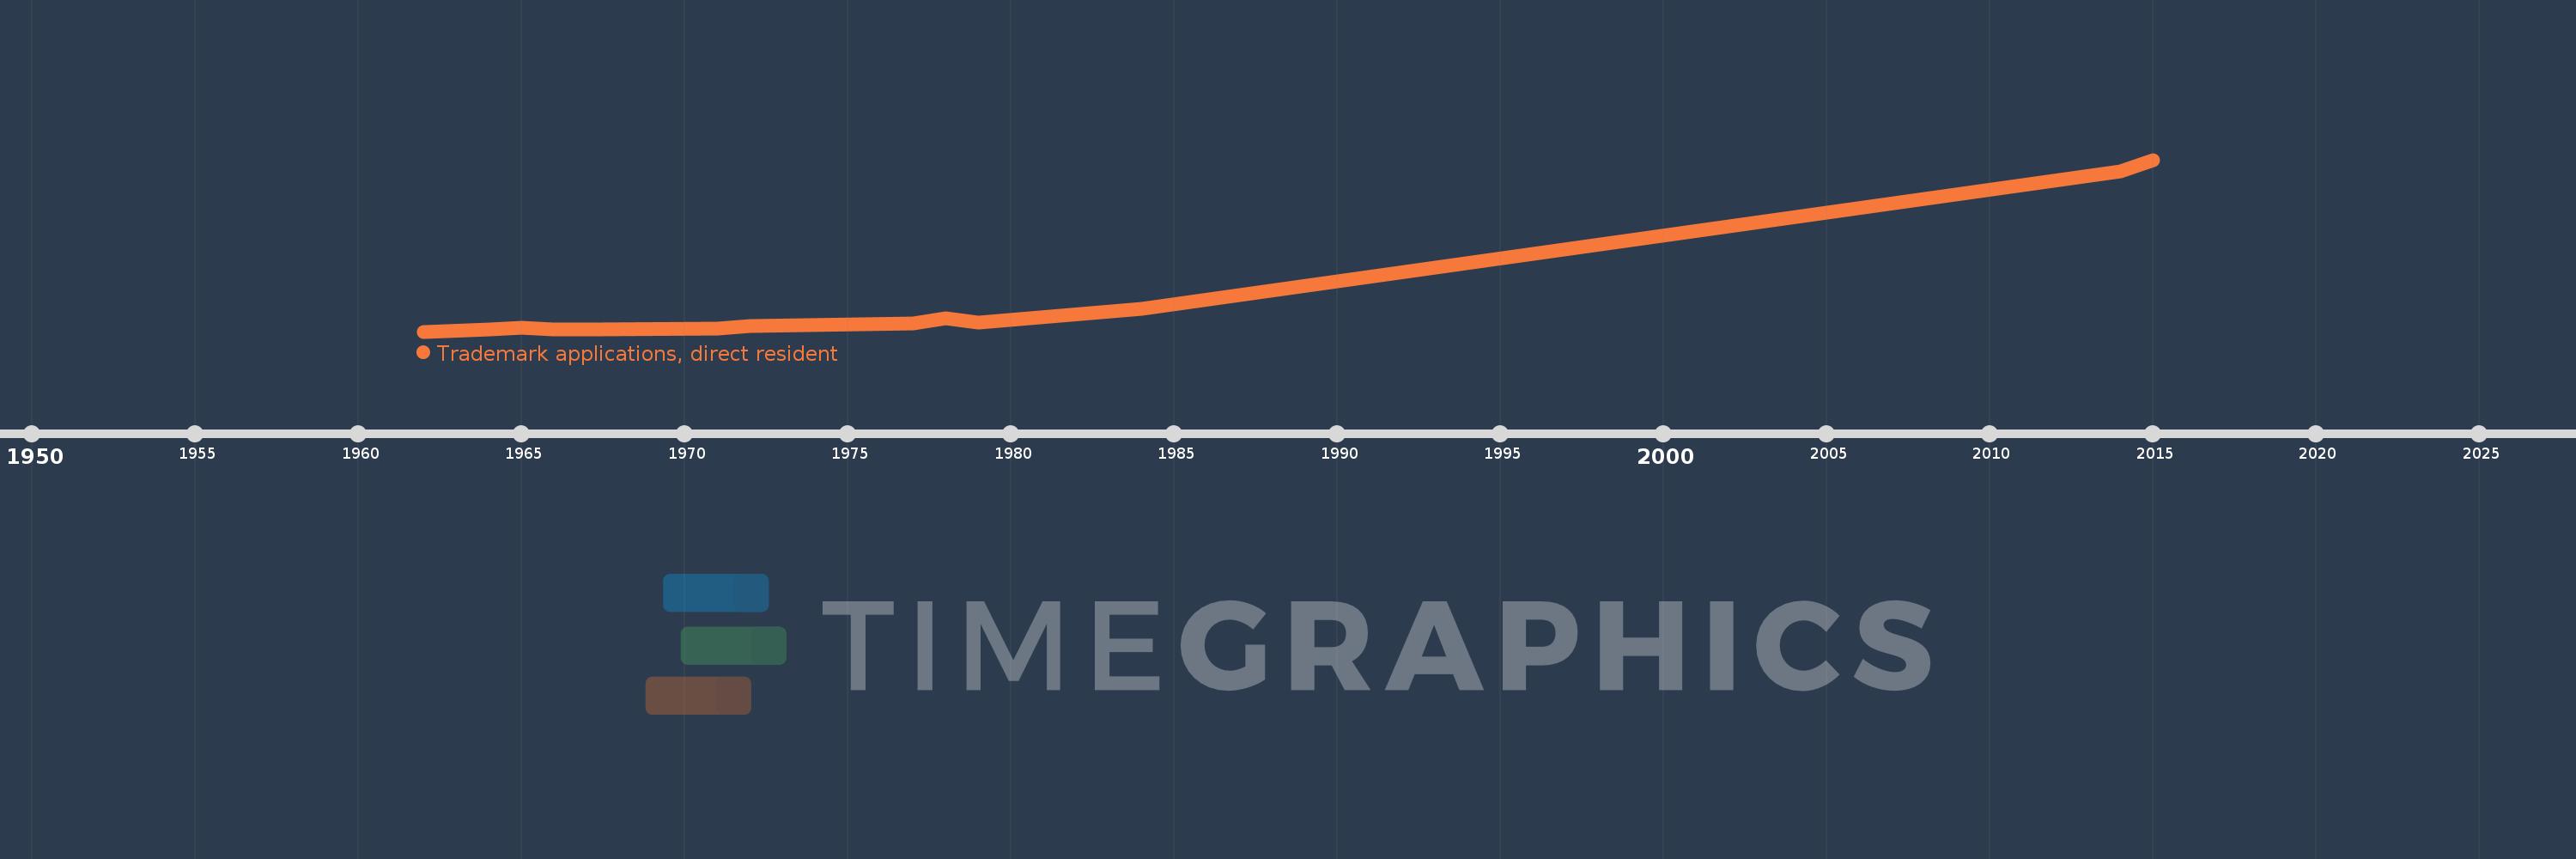
This timeline shows a graph from 1962 to 2015 of Dominican Republic. No data until 1961. Number of actual observations by date: 13.
Source name:
World Development Indicators
Source organization:
World Intellectual Property Organization (WIPO), WIPO Patent Report: Statistics on Worldwide Patent Activity. The International Bureau of WIPO assumes no responsibility with respect to the transformation of these data.
Categories, topics:
Science & Technology
Last updated:
apr 23, 2017
Indicators value changes by year
Meaning:
1.069K
Minimum:
63.0
jan 1, 1962
Maximum:
5.624K
jan 1, 2015
At the date of observation
Value
Absolute change
Change from the previous value
jan 1, 1962
63.0
+63.0
0.0%
jan 1, 1964
128.0
+65.0
103.17%
jan 1, 1965
198.0
+70.0
54.69%
jan 1, 1966
135.0
-63.0
-31.82%
jan 1, 1967
120.0
-15.0
-11.11%
jan 1, 1971
171.0
+51.0
42.5%
jan 1, 1972
239.0
+68.0
39.77%
jan 1, 1977
332.0
+93.0
38.91%
jan 1, 1978
486.0
+154.0
46.39%
jan 1, 1979
363.0
-123.0
-25.31%
jan 1, 1984
790.0
+427.0
117.63%
jan 1, 2014
5.248K
+4.458K
564.3%
jan 1, 2015
5.624K
+376.0
7.16%
Ranking of countries by current statistics by years