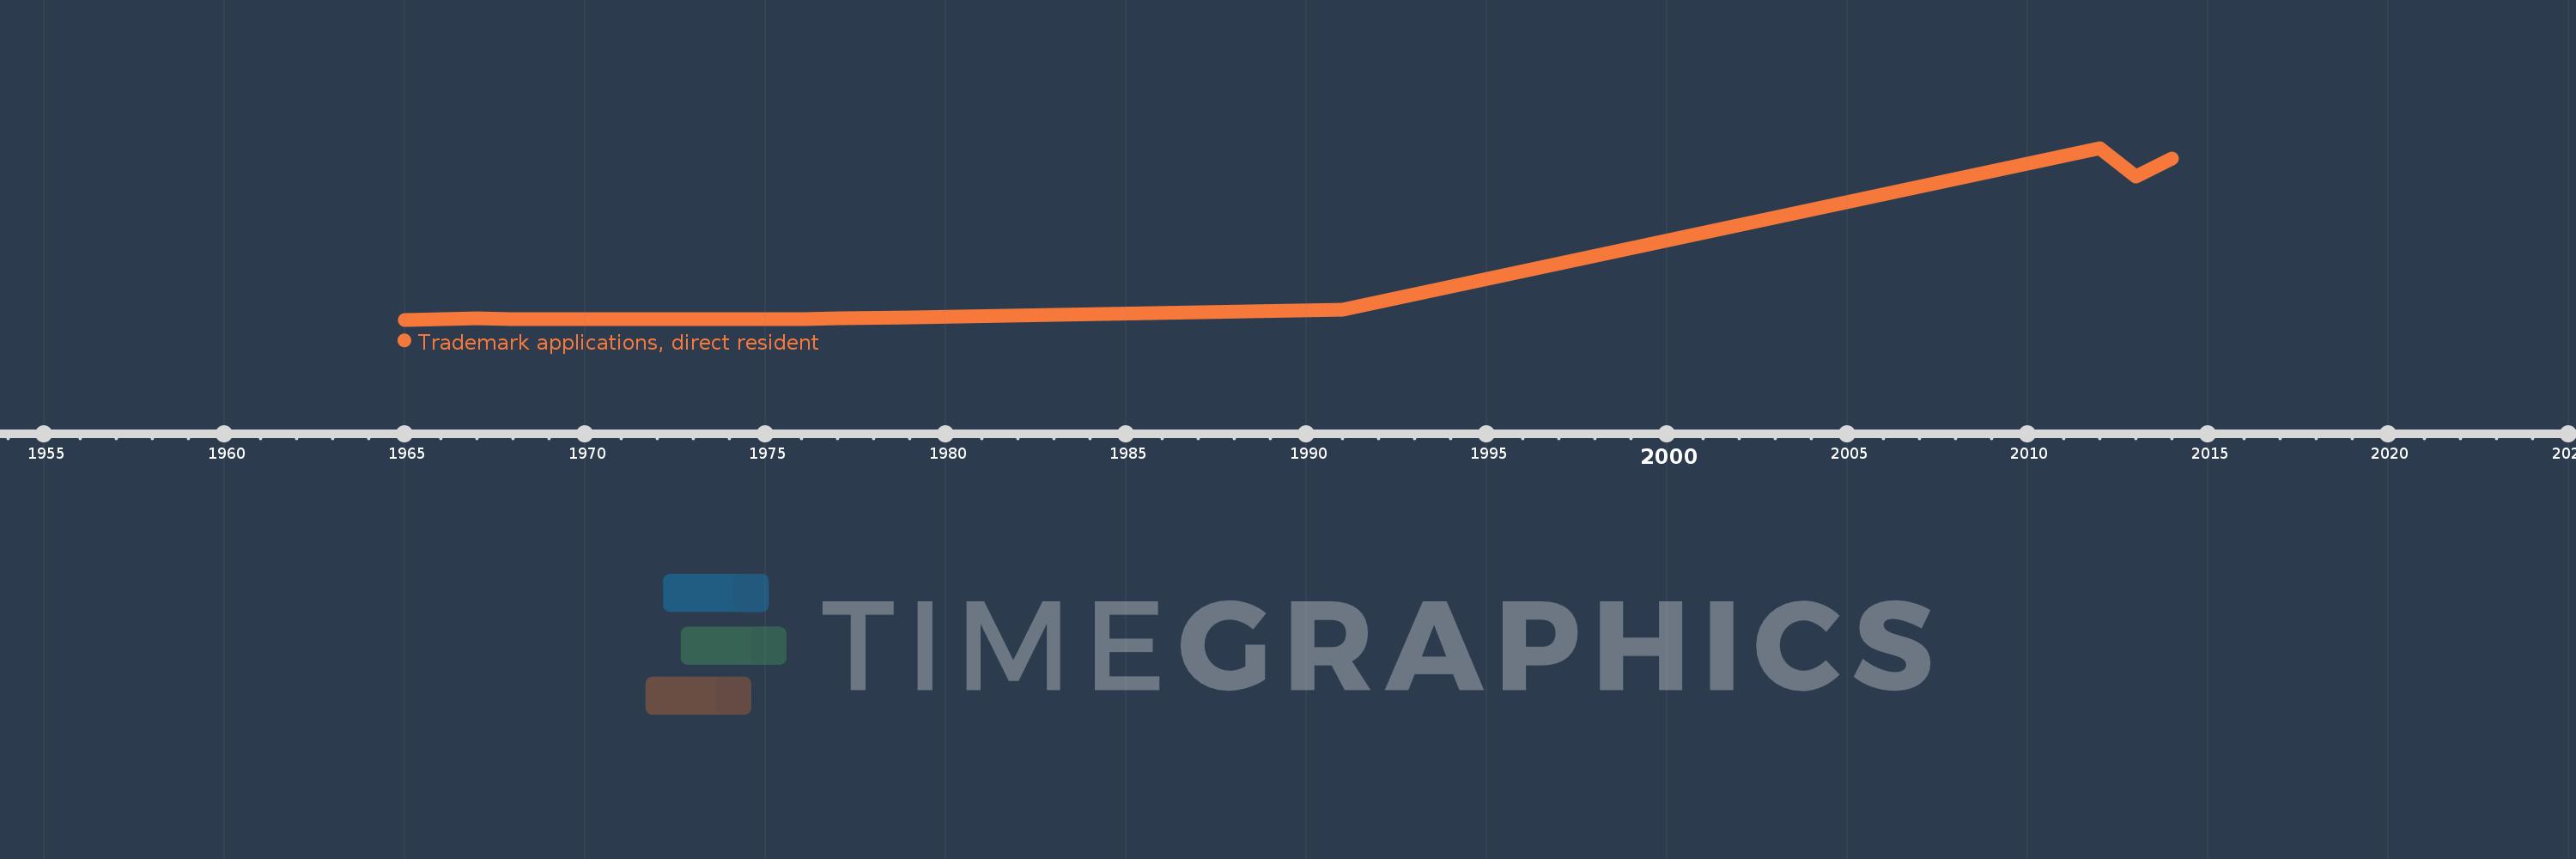
This timeline shows a graph from 1965 to 2014 of Nigeria. No data until 1964. Number of actual observations by date: 10.
Source name:
World Development Indicators
Source organization:
World Intellectual Property Organization (WIPO), WIPO Patent Report: Statistics on Worldwide Patent Activity. The International Bureau of WIPO assumes no responsibility with respect to the transformation of these data.
Categories, topics:
Science & Technology
Last updated:
apr 23, 2017
Indicators value changes by year
Meaning:
6.036K
Minimum:
200.0
jan 1, 1965
Maximum:
20.56K
jan 1, 2012
At the date of observation
Value
Absolute change
Change from the previous value
jan 1, 1965
200.0
+200.0
0.0%
jan 1, 1967
362.0
+162.0
81.0%
jan 1, 1968
250.0
-112.0
-30.94%
jan 1, 1976
240.0
-10.0
-4.0%
jan 1, 1977
353.0
+113.0
47.08%
jan 1, 1979
489.0
+136.0
38.53%
jan 1, 1991
1.392K
+903.0
184.66%
jan 1, 2012
20.56K
+19.168K
1.38K%
jan 1, 2013
17.182K
-3.378K
-16.43%
jan 1, 2014
19.332K
+2.15K
12.51%
Ranking of countries by current statistics by years