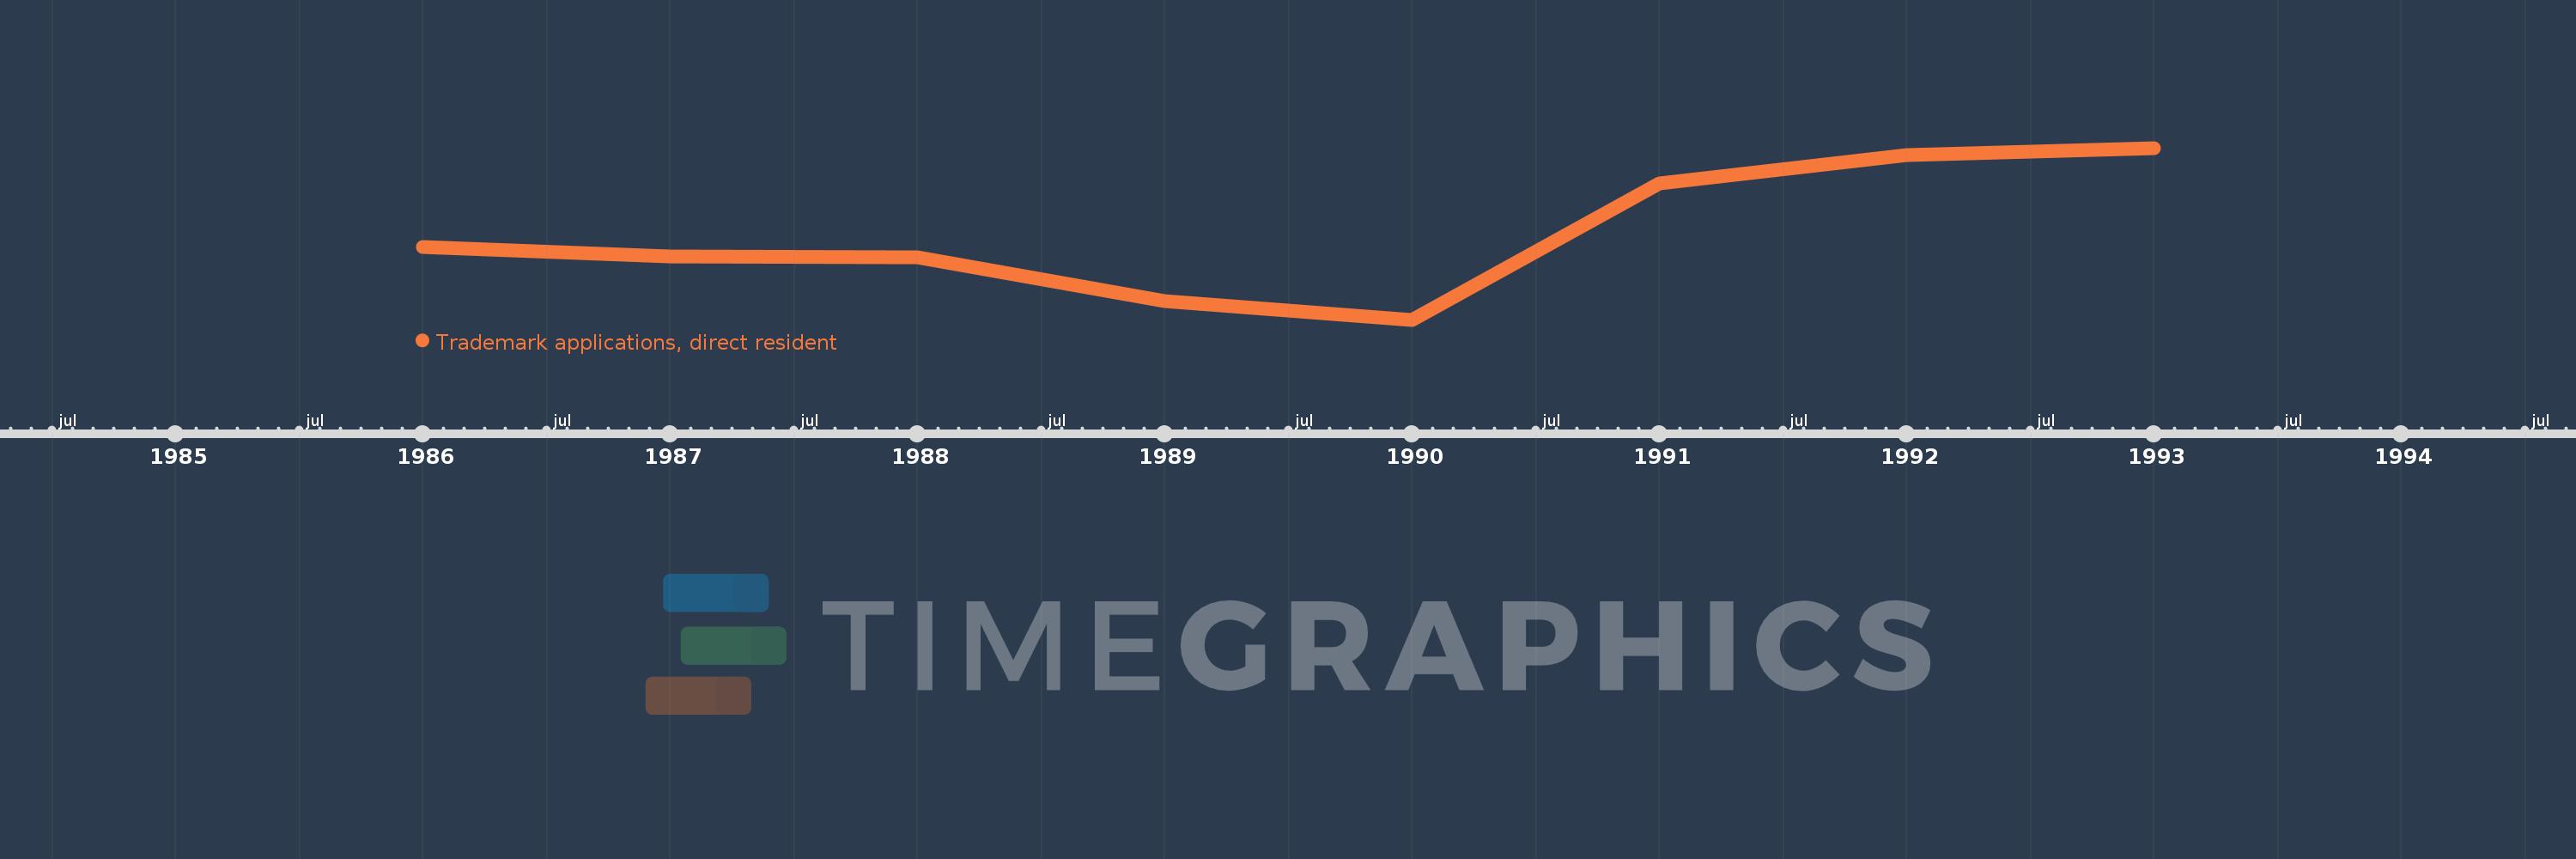
This timeline shows a graph from 1986 to 1993 of Korea, Dem. People’s Rep.. No data until 1985. Number of actual observations by date: 8.
Source name:
World Development Indicators
Source organization:
World Intellectual Property Organization (WIPO), WIPO Patent Report: Statistics on Worldwide Patent Activity. The International Bureau of WIPO assumes no responsibility with respect to the transformation of these data.
Categories, topics:
Science & Technology
Last updated:
apr 23, 2017
Indicators value changes by year
Meaning:
8.17K
Minimum:
2.06K
jan 1, 1990
Maximum:
14.239K
jan 1, 1993
At the date of observation
Value
Absolute change
Change from the previous value
jan 1, 1986
7.22K
+7.22K
0.0%
jan 1, 1987
6.531K
-689.0
-9.54%
jan 1, 1988
6.515K
-16.0
-0.24%
jan 1, 1989
3.367K
-3.148K
-48.32%
jan 1, 1990
2.06K
-1.307K
-38.82%
jan 1, 1991
11.704K
+9.644K
468.16%
jan 1, 1992
13.722K
+2.018K
17.24%
jan 1, 1993
14.239K
+517.0
3.77%
Ranking of countries by current statistics by years