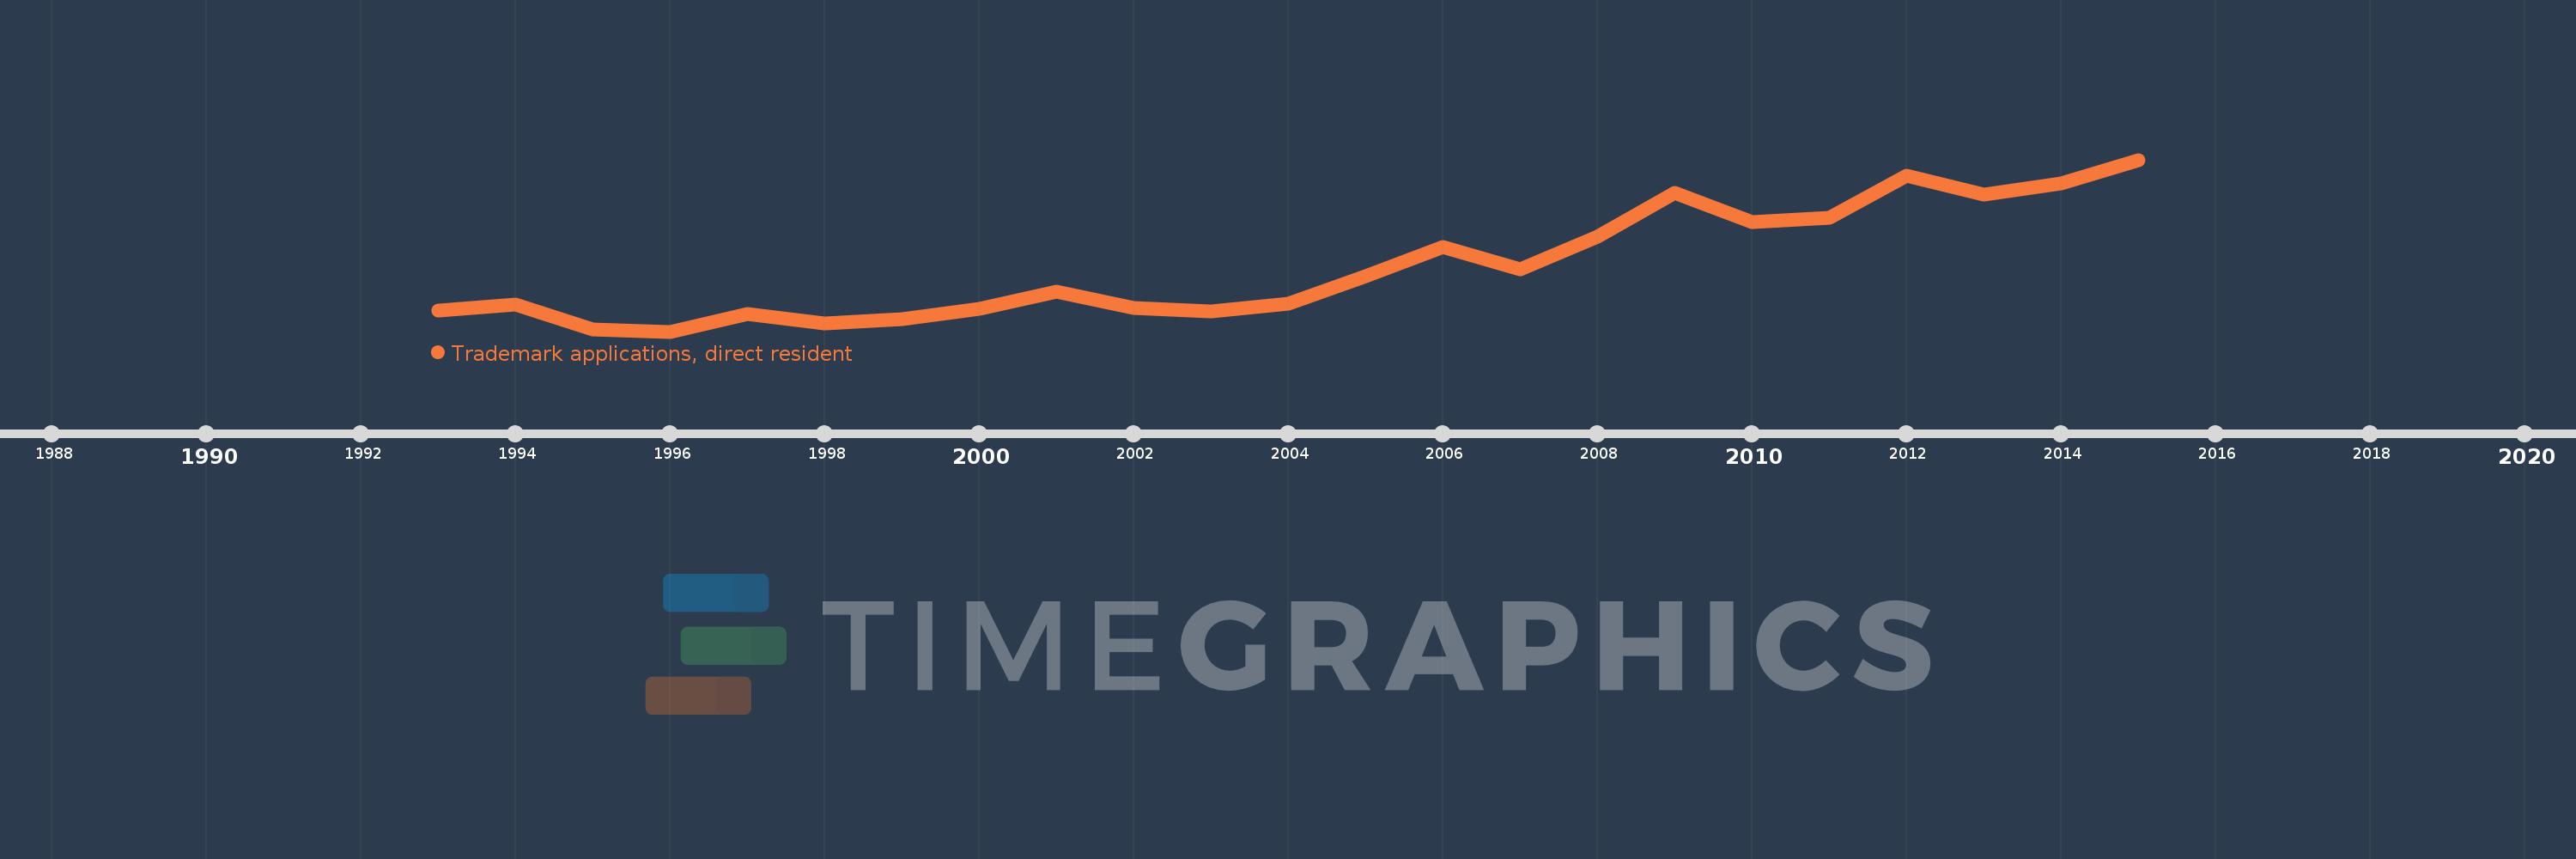
This timeline shows a graph from 1993 to 2015 of Georgia. No data until 1992. Number of actual observations by date: 23.
Source name:
World Development Indicators
Source organization:
World Intellectual Property Organization (WIPO), WIPO Patent Report: Statistics on Worldwide Patent Activity. The International Bureau of WIPO assumes no responsibility with respect to the transformation of these data.
Categories, topics:
Science & Technology
Last updated:
apr 23, 2017
Indicators value changes by year
Meaning:
413.304
Minimum:
108.0
jan 1, 1996
Maximum:
915.0
jan 1, 2015
At the date of observation
Value
Absolute change
Change from the previous value
jan 1, 1993
207.0
+207.0
0.0%
jan 1, 1994
234.0
+27.0
13.04%
jan 1, 1995
117.0
-117.0
-50.0%
jan 1, 1996
108.0
-9.0
-7.69%
jan 1, 1997
190.0
+82.0
75.93%
jan 1, 1998
146.0
-44.0
-23.16%
jan 1, 1999
167.0
+21.0
14.38%
jan 1, 2000
214.0
+47.0
28.14%
jan 1, 2001
296.0
+82.0
38.32%
jan 1, 2002
218.0
-78.0
-26.35%
jan 1, 2003
202.0
-16.0
-7.34%
jan 1, 2004
241.0
+39.0
19.31%
jan 1, 2005
368.0
+127.0
52.7%
jan 1, 2006
507.0
+139.0
37.77%
jan 1, 2007
402.0
-105.0
-20.71%
jan 1, 2008
554.0
+152.0
37.81%
jan 1, 2009
759.0
+205.0
37.0%
jan 1, 2010
621.0
-138.0
-18.18%
jan 1, 2011
641.0
+20.0
3.22%
jan 1, 2012
841.0
+200.0
31.2%
jan 1, 2013
753.0
-88.0
-10.46%
jan 1, 2014
805.0
+52.0
6.91%
jan 1, 2015
915.0
+110.0
13.66%
Ranking of countries by current statistics by years