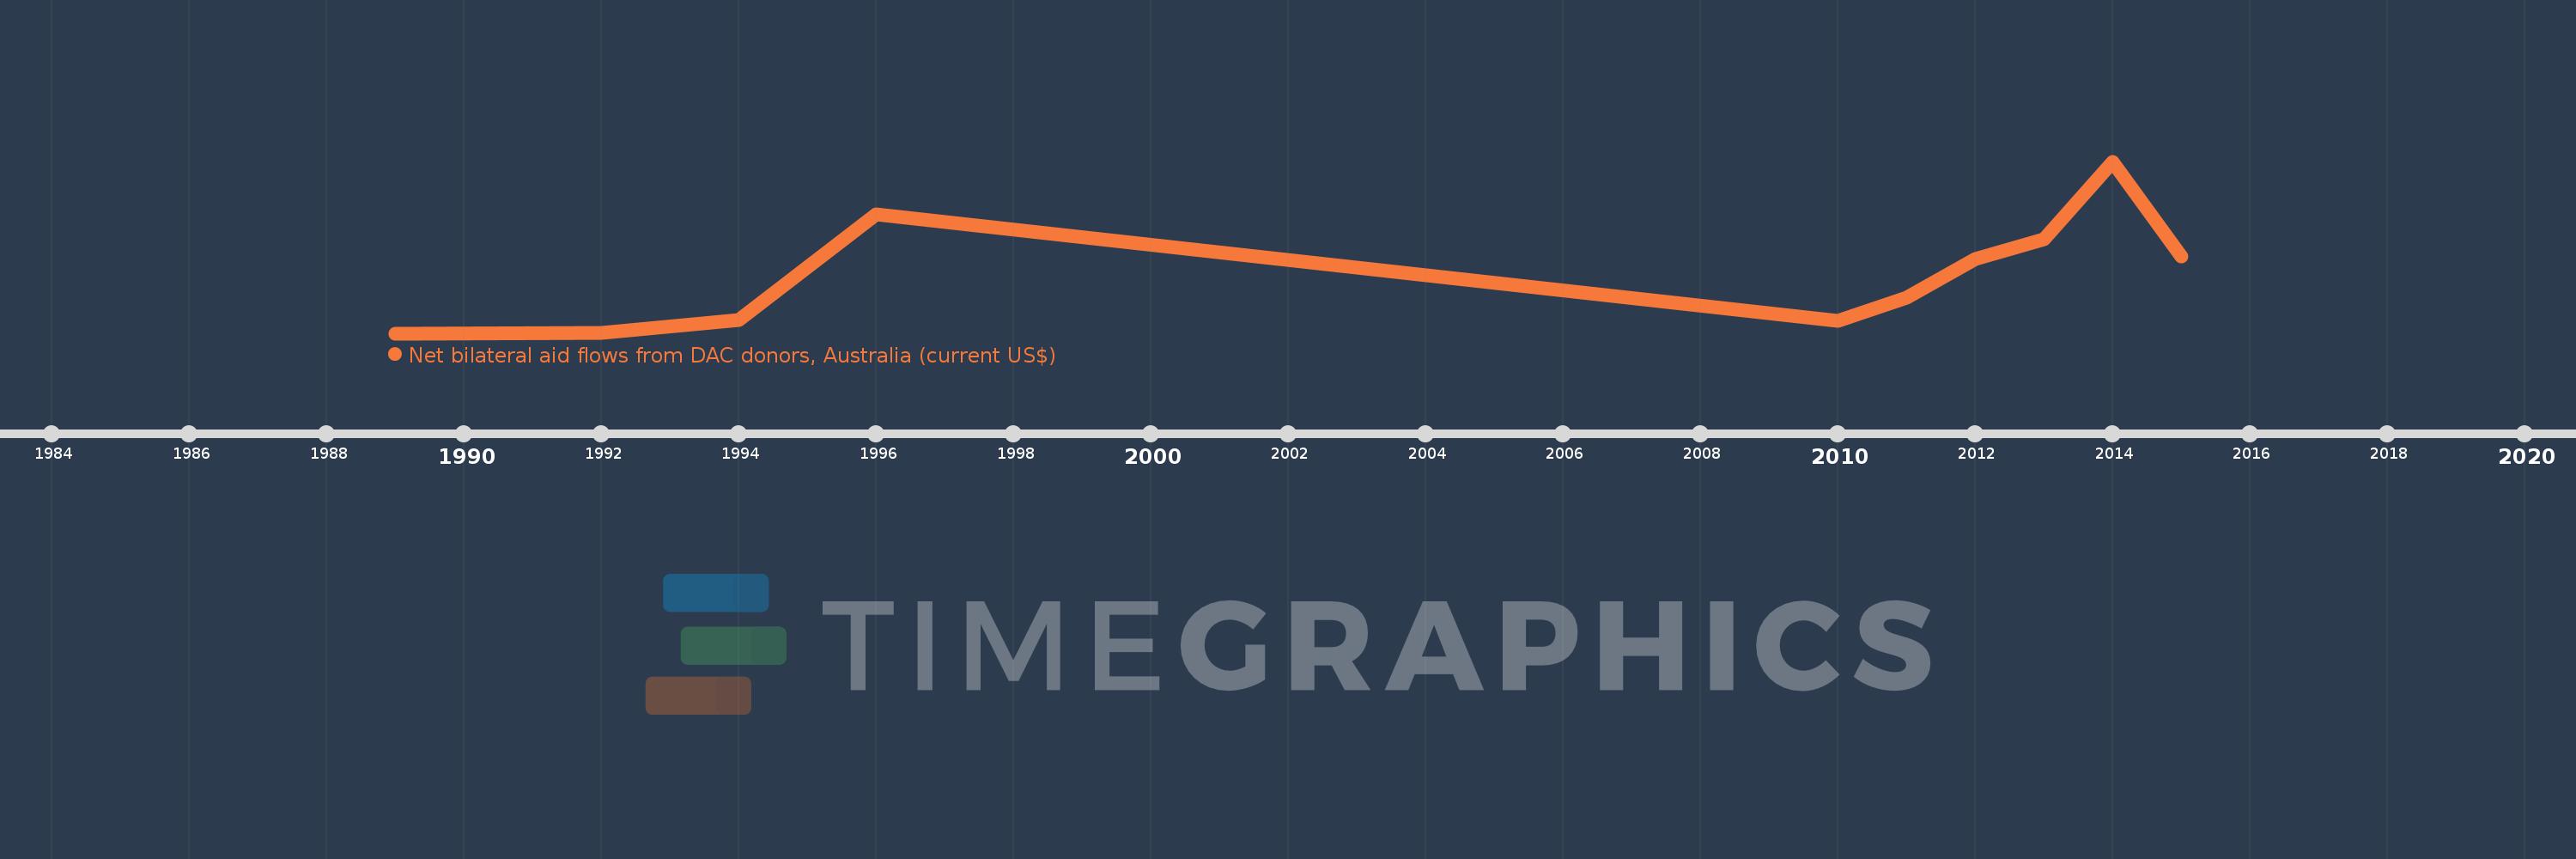
This timeline shows a graph from 1989 to 2015 of Burundi. No data until 1988. Number of actual observations by date: 10.
Source name:
World Development Indicators
Source organization:
Development Assistance Committee of the Organisation for Economic Co-operation and Development, Geographical Distribution of Financial Flows to Developing Countries, Development Co-operation Report, and International Development Statistics database. Data are available online at: www.oecd.org/dac/stats/idsonline.
Categories, topics:
Aid Effectiveness
Last updated:
apr 23, 2017
Indicators value changes by year
Meaning:
748.0K
Minimum:
10.0K
jan 1, 1989
Maximum:
2.13 mln
jan 1, 2014
At the date of observation
Value
Absolute change
Change from the previous value
jan 1, 1989
10.0K
+10.0K
0.0%
jan 1, 1992
20.0K
+10.0K
100.0%
jan 1, 1994
170.0K
+150.0K
750.0%
jan 1, 1996
1.48 mln
+1.31 mln
770.59%
jan 1, 2010
160.0K
-1.32 mln
-89.19%
jan 1, 2011
450.0K
+290.0K
181.25%
jan 1, 2012
930.0K
+480.0K
106.67%
jan 1, 2013
1.17 mln
+240.0K
25.81%
jan 1, 2014
2.13 mln
+960.0K
82.05%
jan 1, 2015
960.0K
-1.17 mln
-54.93%
Ranking of countries by current statistics by years