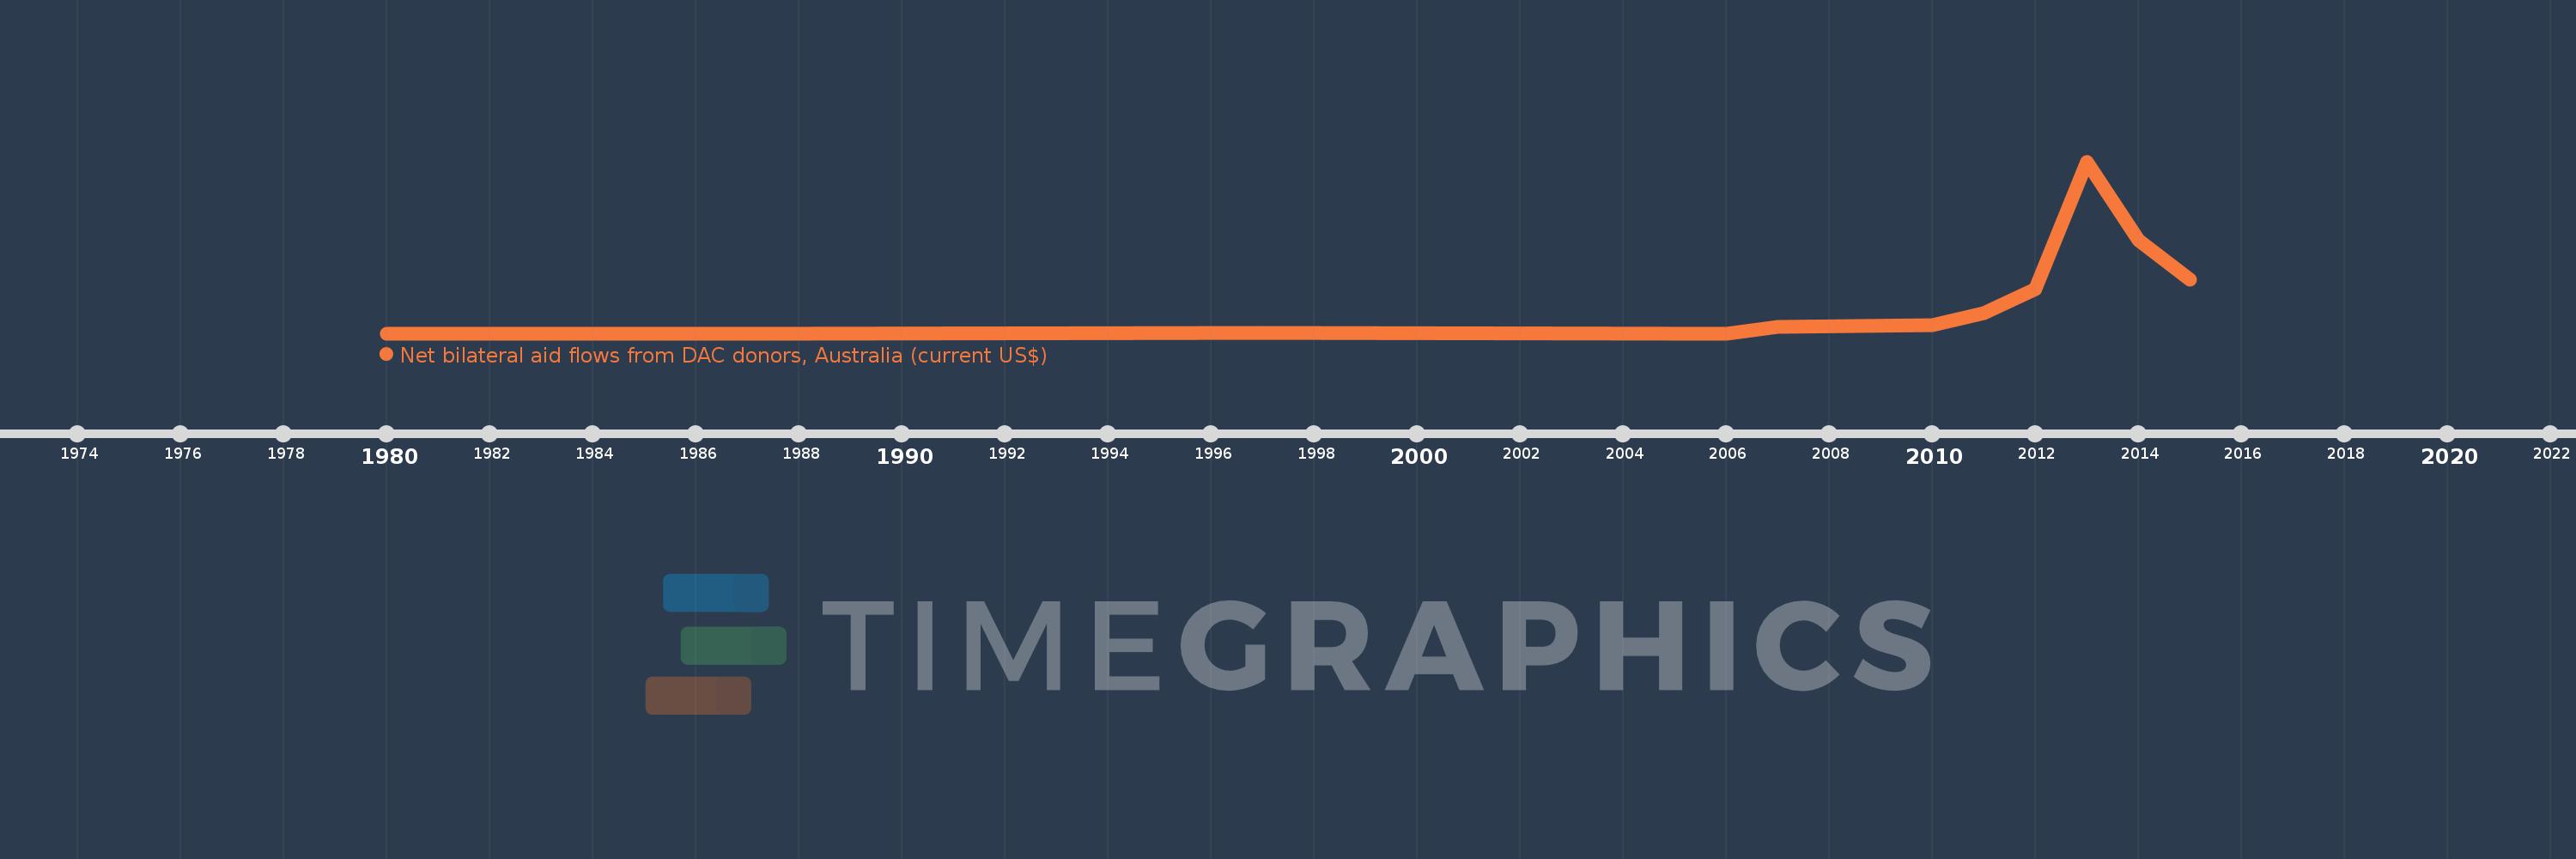
This timeline shows a graph from 1980 to 2015 of Cameroon. No data until 1979. Number of actual observations by date: 11.
Source name:
World Development Indicators
Source organization:
Development Assistance Committee of the Organisation for Economic Co-operation and Development, Geographical Distribution of Financial Flows to Developing Countries, Development Co-operation Report, and International Development Statistics database. Data are available online at: www.oecd.org/dac/stats/idsonline.
Categories, topics:
Aid Effectiveness
Last updated:
apr 23, 2017
Indicators value changes by year
Meaning:
566.364K
Minimum:
10.0K
jan 1, 1980
Maximum:
2.65 mln
jan 1, 2013
At the date of observation
Value
Absolute change
Change from the previous value
jan 1, 1980
10.0K
+10.0K
0.0%
jan 1, 1987
10.0K
0.0
0.0%
jan 1, 1997
20.0K
+10.0K
100.0%
jan 1, 2006
10.0K
-10.0K
-50.0%
jan 1, 2007
110.0K
+100.0K
1000.0%
jan 1, 2010
140.0K
+30.0K
27.27%
jan 1, 2011
320.0K
+180.0K
128.57%
jan 1, 2012
690.0K
+370.0K
115.63%
jan 1, 2013
2.65 mln
+1.96 mln
284.06%
jan 1, 2014
1.44 mln
-1.21 mln
-45.66%
jan 1, 2015
830.0K
-610.0K
-42.36%
Ranking of countries by current statistics by years