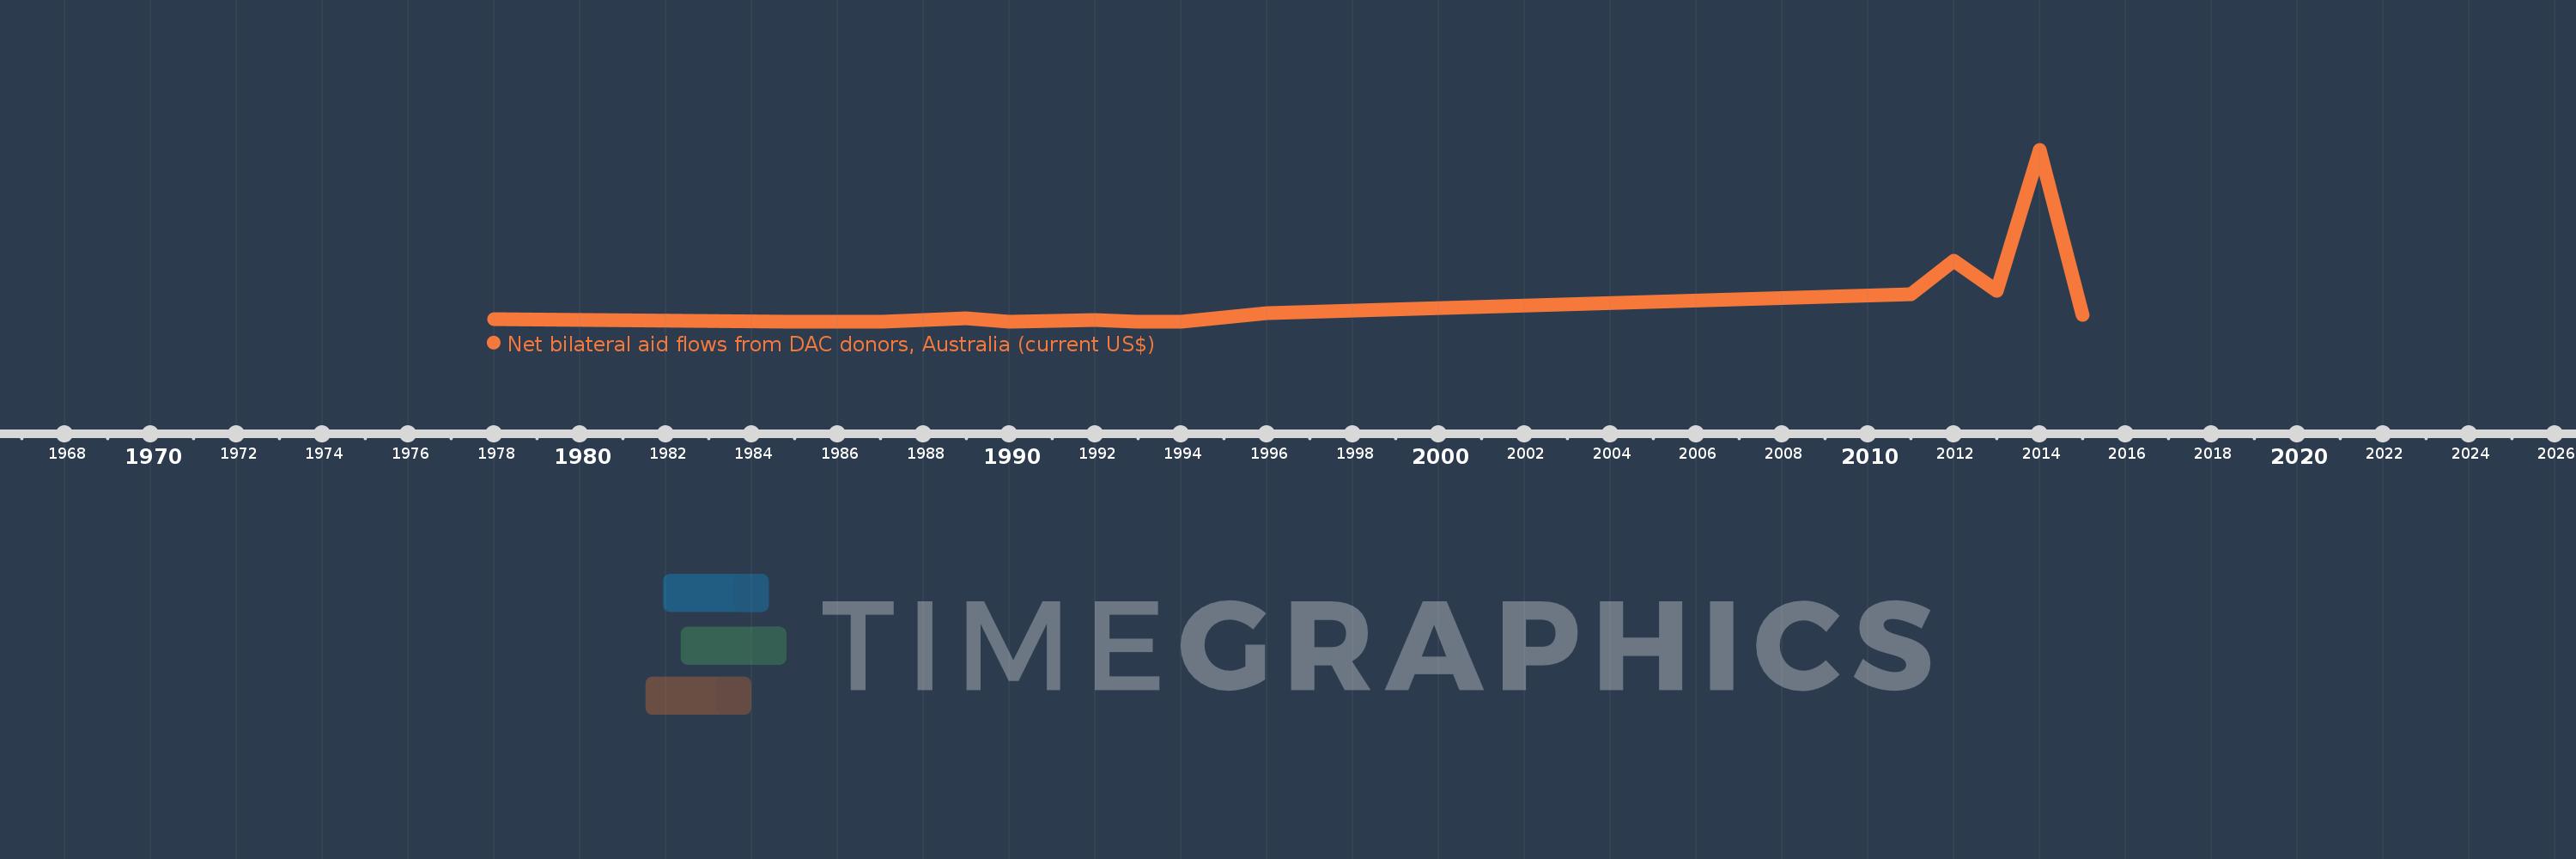
This timeline shows a graph from 1978 to 2015 of Burkina Faso. No data until 1977. Number of actual observations by date: 15.
Source name:
World Development Indicators
Source organization:
Development Assistance Committee of the Organisation for Economic Co-operation and Development, Geographical Distribution of Financial Flows to Developing Countries, Development Co-operation Report, and International Development Statistics database. Data are available online at: www.oecd.org/dac/stats/idsonline.
Categories, topics:
Aid Effectiveness
Last updated:
apr 23, 2017
Indicators value changes by year
Meaning:
320.667K
Minimum:
10.0K
jan 1, 1987
Maximum:
2.51 mln
jan 1, 2014
At the date of observation
Value
Absolute change
Change from the previous value
jan 1, 1978
50.0K
+50.0K
0.0%
jan 1, 1985
20.0K
-30.0K
-60.0%
jan 1, 1987
10.0K
-10.0K
-50.0%
jan 1, 1989
70.0K
+60.0K
600.0%
jan 1, 1990
10.0K
-60.0K
-85.71%
jan 1, 1991
30.0K
+20.0K
200.0%
jan 1, 1992
40.0K
+10.0K
33.33%
jan 1, 1993
20.0K
-20.0K
-50.0%
jan 1, 1994
10.0K
-10.0K
-50.0%
jan 1, 1996
140.0K
+130.0K
1.3K%
jan 1, 2011
420.0K
+280.0K
200.0%
jan 1, 2012
900.0K
+480.0K
114.29%
jan 1, 2013
470.0K
-430.0K
-47.78%
jan 1, 2014
2.51 mln
+2.04 mln
434.04%
jan 1, 2015
110.0K
-2.4 mln
-95.62%
Ranking of countries by current statistics by years