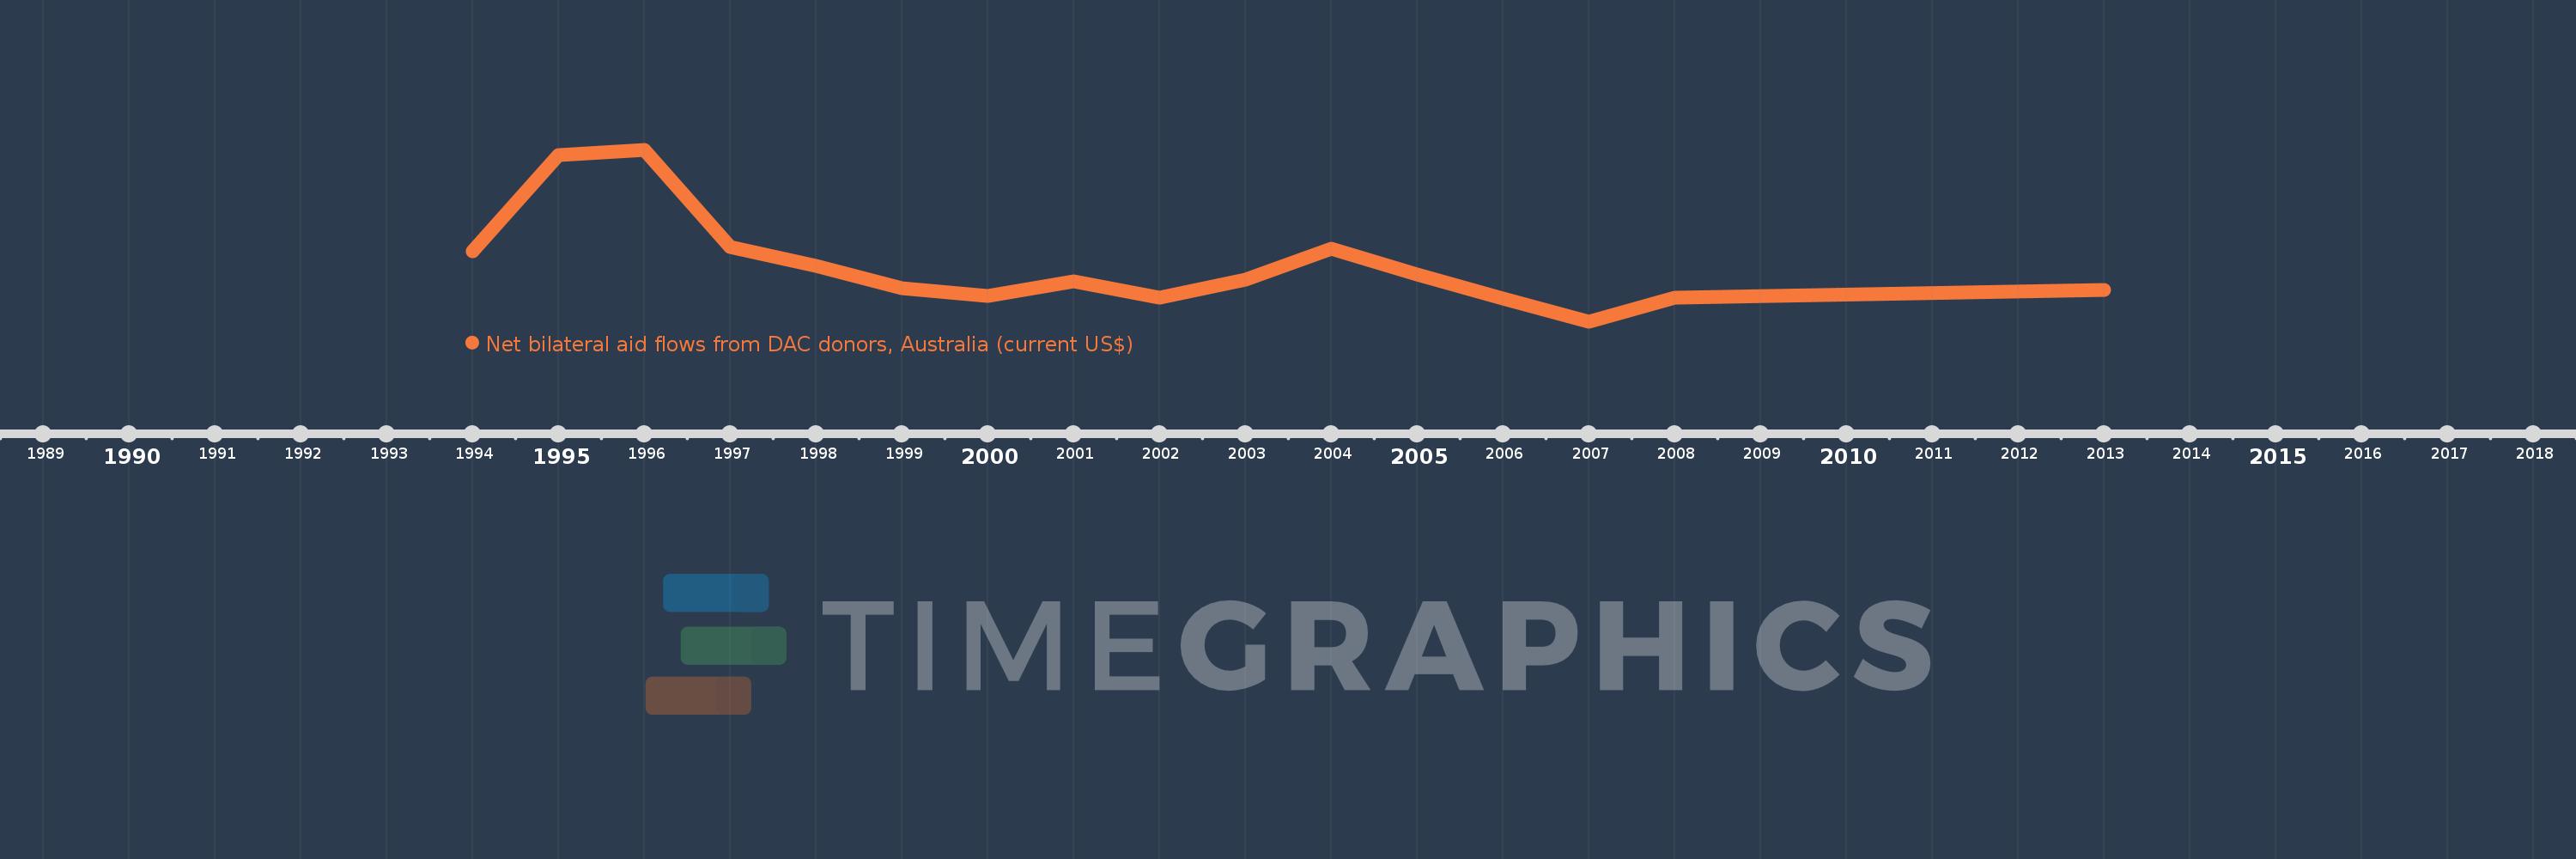
This timeline shows a graph from 1994 to 2013 of Eritrea. No data until 1993. Number of actual observations by date: 16.
Source name:
World Development Indicators
Source organization:
Development Assistance Committee of the Organisation for Economic Co-operation and Development, Geographical Distribution of Financial Flows to Developing Countries, Development Co-operation Report, and International Development Statistics database. Data are available online at: www.oecd.org/dac/stats/idsonline.
Categories, topics:
Aid Effectiveness
Last updated:
apr 23, 2017
Indicators value changes by year
Meaning:
1.111 mln
Minimum:
-750.0K
jan 1, 2007
Maximum:
4.88 mln
jan 1, 1996
At the date of observation
Value
Absolute change
Change from the previous value
jan 1, 1994
1.58 mln
+1.58 mln
0.0%
jan 1, 1995
4.72 mln
+3.14 mln
198.73%
jan 1, 1996
4.88 mln
+160.0K
3.39%
jan 1, 1997
1.7 mln
-3.18 mln
-65.16%
jan 1, 1998
1.08 mln
-620.0K
-36.47%
jan 1, 1999
370.0K
-710.0K
-65.74%
jan 1, 2000
100.0K
-270.0K
-72.97%
jan 1, 2001
590.0K
+490.0K
490.0%
jan 1, 2002
50.0K
-540.0K
-91.53%
jan 1, 2003
630.0K
+580.0K
1.16K%
jan 1, 2004
1.66 mln
+1.03 mln
163.49%
jan 1, 2005
810.0K
-850.0K
-51.2%
jan 1, 2006
10.0K
-800.0K
-98.77%
jan 1, 2007
-750.0K
-760.0K
-7.6K%
jan 1, 2008
50.0K
+800.0K
-106.67%
jan 1, 2013
300.0K
+250.0K
500.0%
Ranking of countries by current statistics by years