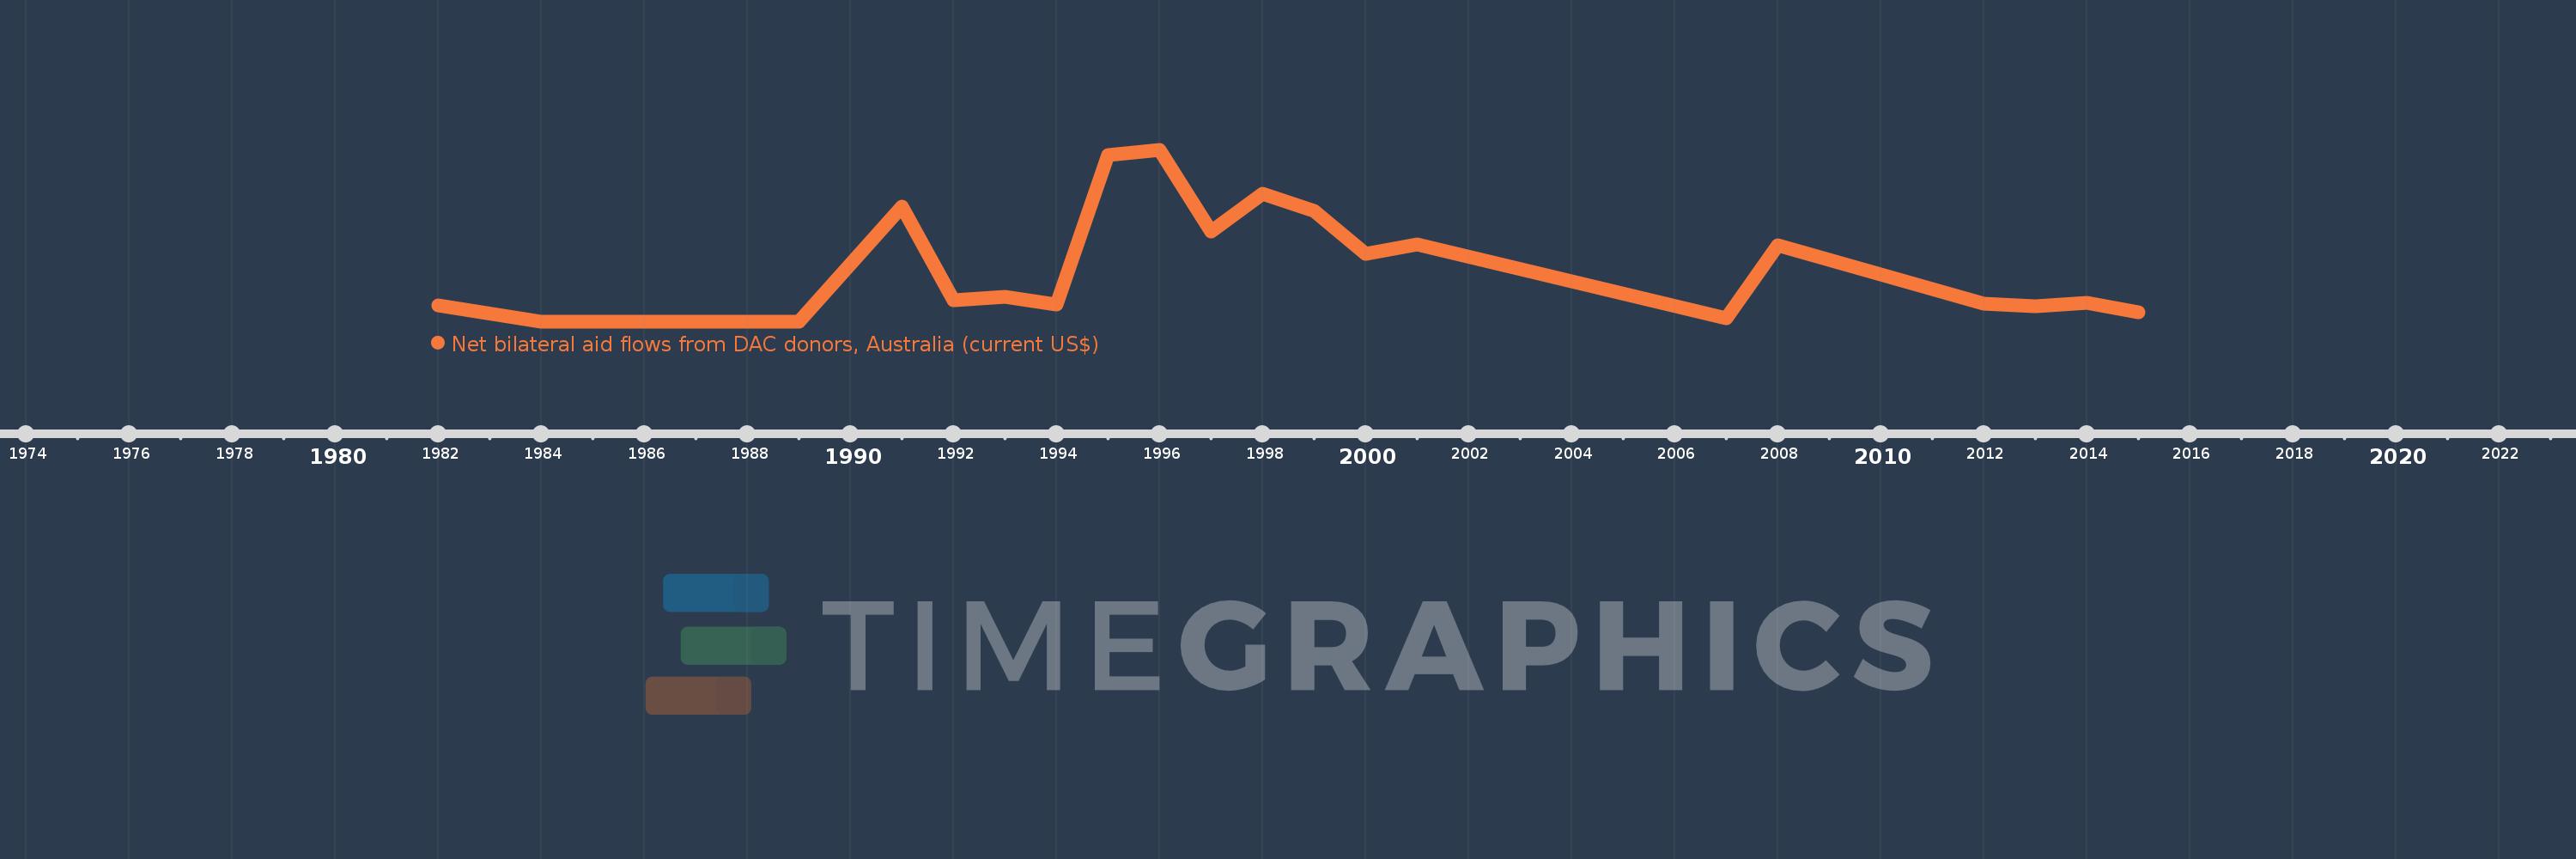
This timeline shows a graph from 1982 to 2015 of Angola. No data until 1981. Number of actual observations by date: 21.
Source name:
World Development Indicators
Source organization:
Development Assistance Committee of the Organisation for Economic Co-operation and Development, Geographical Distribution of Financial Flows to Developing Countries, Development Co-operation Report, and International Development Statistics database. Data are available online at: www.oecd.org/dac/stats/idsonline.
Categories, topics:
Aid Effectiveness
Last updated:
apr 23, 2017
Indicators value changes by year
Meaning:
642.381K
Minimum:
10.0K
jan 1, 1984
Maximum:
1.99 mln
jan 1, 1996
At the date of observation
Value
Absolute change
Change from the previous value
jan 1, 1982
200.0K
+200.0K
0.0%
jan 1, 1984
10.0K
-190.0K
-95.0%
jan 1, 1988
10.0K
0.0
0.0%
jan 1, 1989
10.0K
0.0
0.0%
jan 1, 1991
1.34 mln
+1.33 mln
13.3K%
jan 1, 1992
260.0K
-1.08 mln
-80.6%
jan 1, 1993
300.0K
+40.0K
15.38%
jan 1, 1994
210.0K
-90.0K
-30.0%
jan 1, 1995
1.93 mln
+1.72 mln
819.05%
jan 1, 1996
1.99 mln
+60.0K
3.11%
jan 1, 1997
1.05 mln
-940.0K
-47.24%
jan 1, 1998
1.49 mln
+440.0K
41.9%
jan 1, 1999
1.29 mln
-200.0K
-13.42%
jan 1, 2000
800.0K
-490.0K
-37.98%
jan 1, 2001
900.0K
+100.0K
12.5%
jan 1, 2007
50.0K
-850.0K
-94.44%
jan 1, 2008
890.0K
+840.0K
1.68K%
jan 1, 2012
220.0K
-670.0K
-75.28%
jan 1, 2013
190.0K
-30.0K
-13.64%
jan 1, 2014
230.0K
+40.0K
21.05%
jan 1, 2015
120.0K
-110.0K
-47.83%
Ranking of countries by current statistics by years