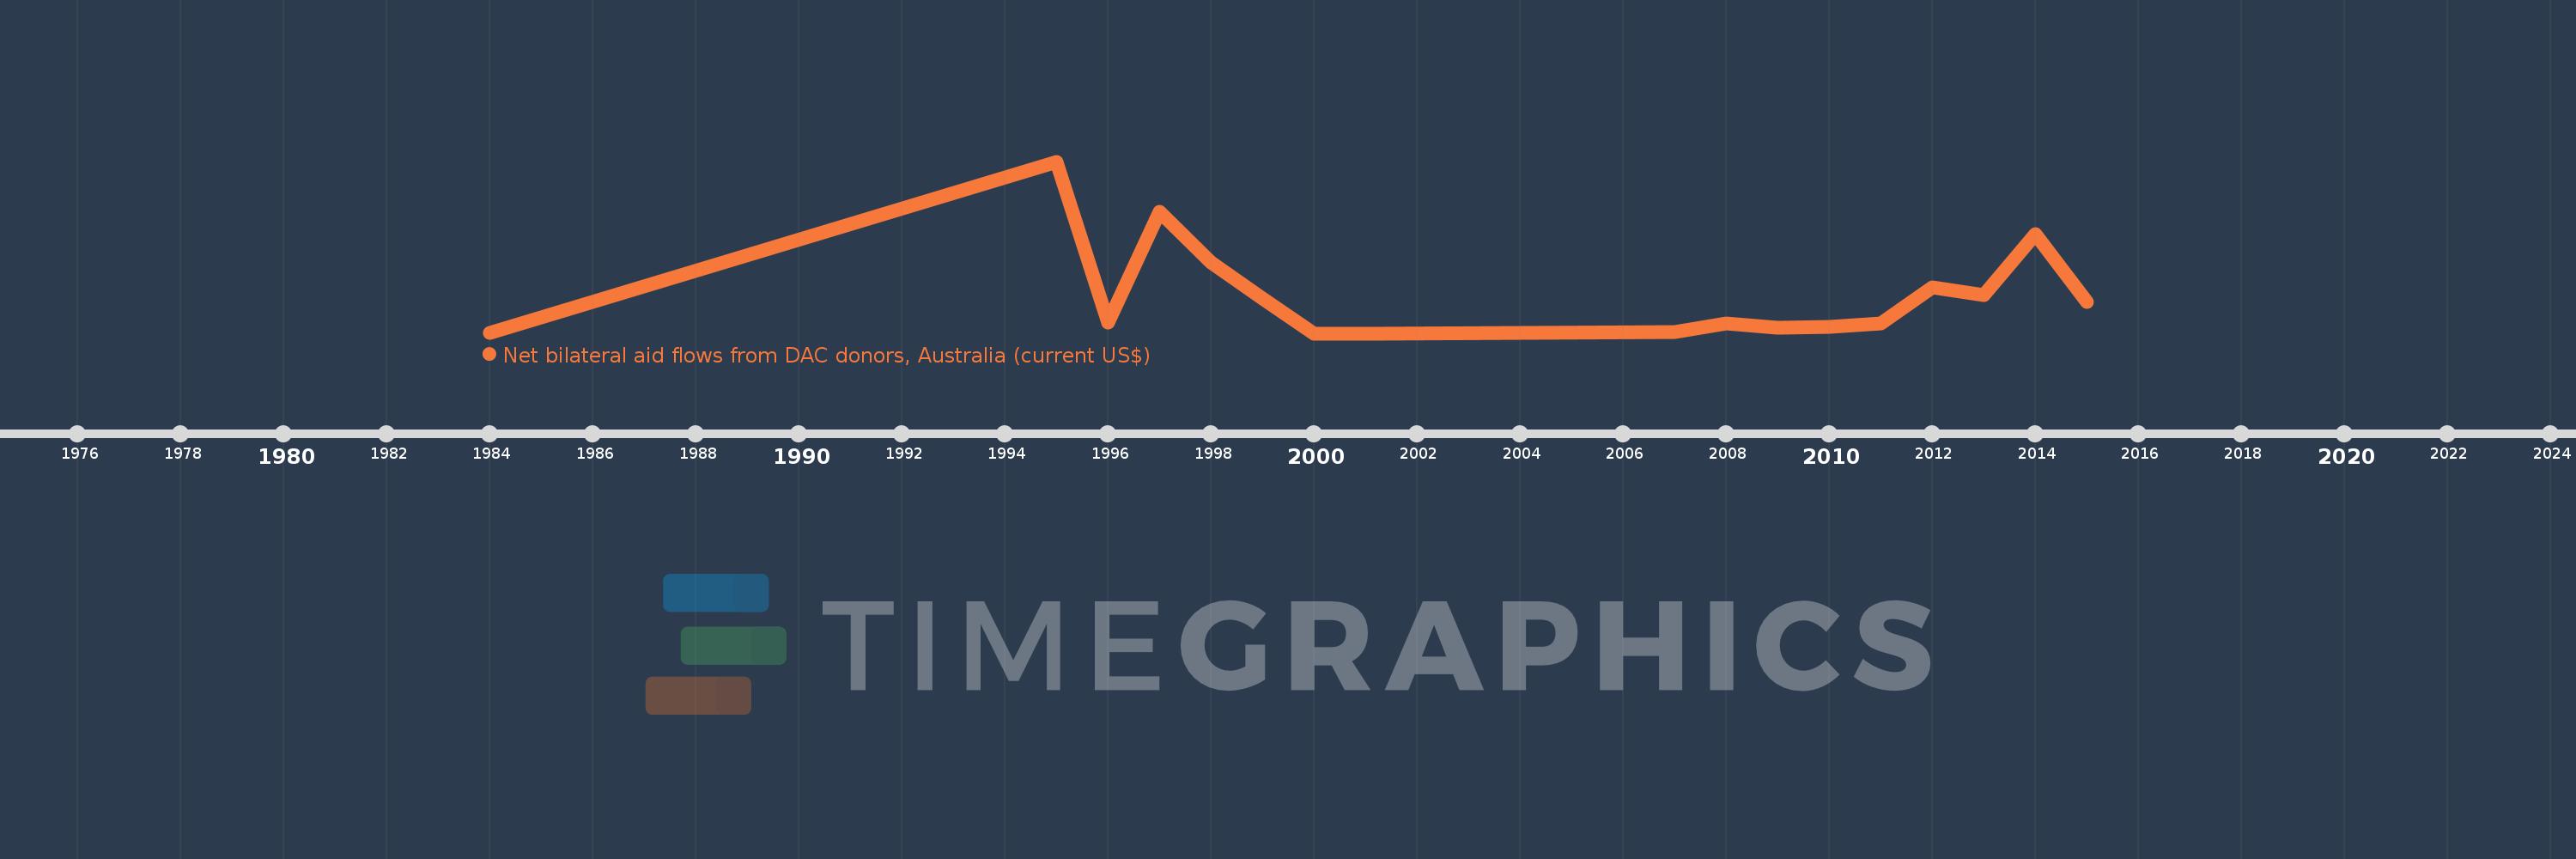
This timeline shows a graph from 1984 to 2015 of Rwanda. No data until 1983. Number of actual observations by date: 17.
Source name:
World Development Indicators
Source organization:
Development Assistance Committee of the Organisation for Economic Co-operation and Development, Geographical Distribution of Financial Flows to Developing Countries, Development Co-operation Report, and International Development Statistics database. Data are available online at: www.oecd.org/dac/stats/idsonline.
Categories, topics:
Aid Effectiveness
Last updated:
apr 23, 2017
Indicators value changes by year
Meaning:
1.739 mln
Minimum:
20.0K
jan 1, 2000
Maximum:
7.67 mln
jan 1, 1995
At the date of observation
Value
Absolute change
Change from the previous value
jan 1, 1984
40.0K
+40.0K
0.0%
jan 1, 1995
7.67 mln
+7.63 mln
19.07K%
jan 1, 1996
480.0K
-7.19 mln
-93.74%
jan 1, 1997
5.44 mln
+4.96 mln
1.03K%
jan 1, 1998
3.18 mln
-2.26 mln
-41.54%
jan 1, 1999
1.57 mln
-1.61 mln
-50.63%
jan 1, 2000
20.0K
-1.55 mln
-98.73%
jan 1, 2001
20.0K
0.0
0.0%
jan 1, 2007
70.0K
+50.0K
250.0%
jan 1, 2008
460.0K
+390.0K
557.14%
jan 1, 2009
250.0K
-210.0K
-45.65%
jan 1, 2010
290.0K
+40.0K
16.0%
jan 1, 2011
460.0K
+170.0K
58.62%
jan 1, 2012
2.08 mln
+1.62 mln
352.17%
jan 1, 2013
1.72 mln
-360.0K
-17.31%
jan 1, 2014
4.42 mln
+2.7 mln
156.98%
jan 1, 2015
1.4 mln
-3.02 mln
-68.33%
Ranking of countries by current statistics by years