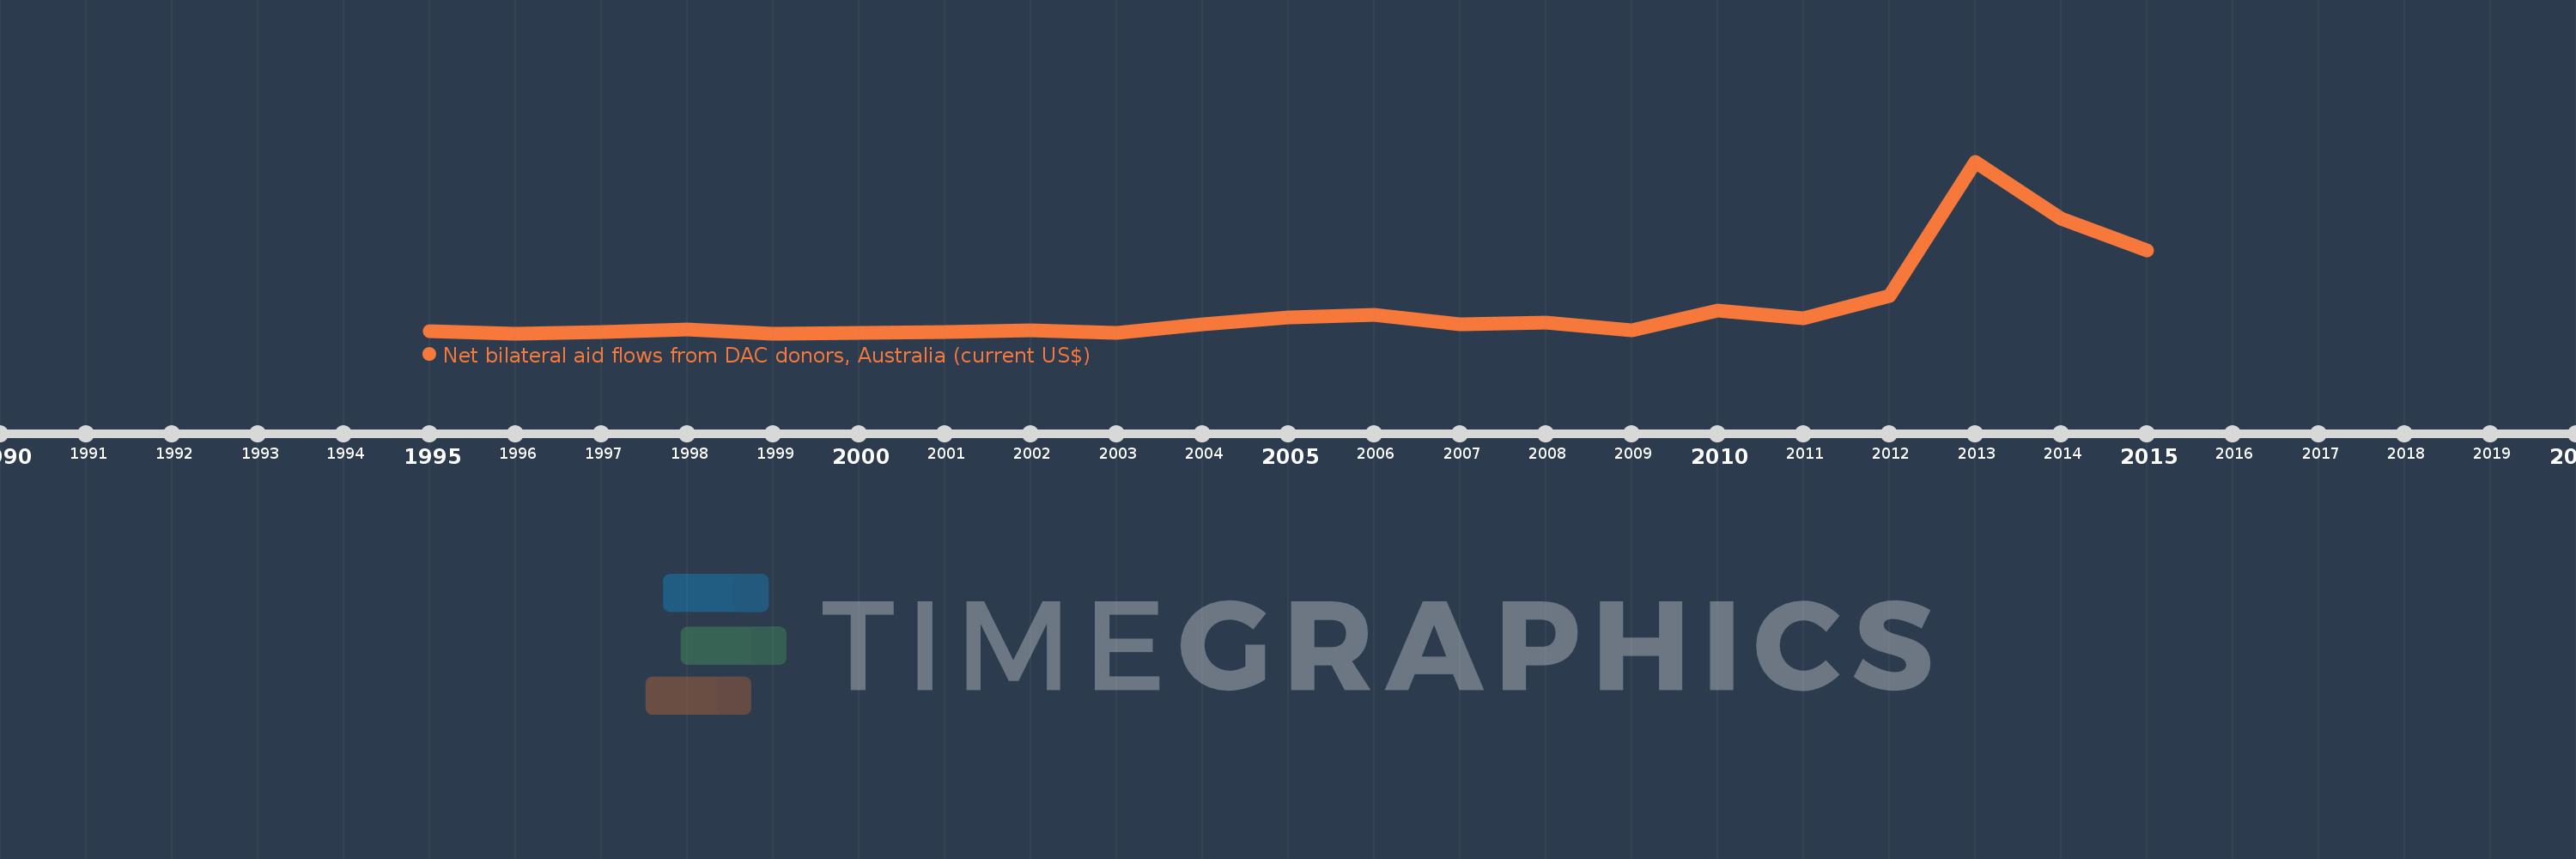
This timeline shows a graph from 1995 to 2015 of Palau. No data until 1994. Number of actual observations by date: 21.
Source name:
World Development Indicators
Source organization:
Development Assistance Committee of the Organisation for Economic Co-operation and Development, Geographical Distribution of Financial Flows to Developing Countries, Development Co-operation Report, and International Development Statistics database. Data are available online at: www.oecd.org/dac/stats/idsonline.
Categories, topics:
Aid Effectiveness
Last updated:
apr 23, 2017
Indicators value changes by year
Meaning:
1.099 mln
Minimum:
170.0K
jan 1, 1996
Maximum:
6.56 mln
jan 1, 2013
At the date of observation
Value
Absolute change
Change from the previous value
jan 1, 1995
260.0K
+260.0K
0.0%
jan 1, 1996
170.0K
-90.0K
-34.62%
jan 1, 1997
230.0K
+60.0K
35.29%
jan 1, 1998
310.0K
+80.0K
34.78%
jan 1, 1999
170.0K
-140.0K
-45.16%
jan 1, 2000
190.0K
+20.0K
11.76%
jan 1, 2001
220.0K
+30.0K
15.79%
jan 1, 2002
270.0K
+50.0K
22.73%
jan 1, 2003
180.0K
-90.0K
-33.33%
jan 1, 2004
500.0K
+320.0K
177.78%
jan 1, 2005
760.0K
+260.0K
52.0%
jan 1, 2006
870.0K
+110.0K
14.47%
jan 1, 2007
520.0K
-350.0K
-40.23%
jan 1, 2008
580.0K
+60.0K
11.54%
jan 1, 2009
290.0K
-290.0K
-50.0%
jan 1, 2010
1.01 mln
+720.0K
248.28%
jan 1, 2011
740.0K
-270.0K
-26.73%
jan 1, 2012
1.57 mln
+830.0K
112.16%
jan 1, 2013
6.56 mln
+4.99 mln
317.83%
jan 1, 2014
4.42 mln
-2.14 mln
-32.62%
jan 1, 2015
3.26 mln
-1.16 mln
-26.24%
Ranking of countries by current statistics by years