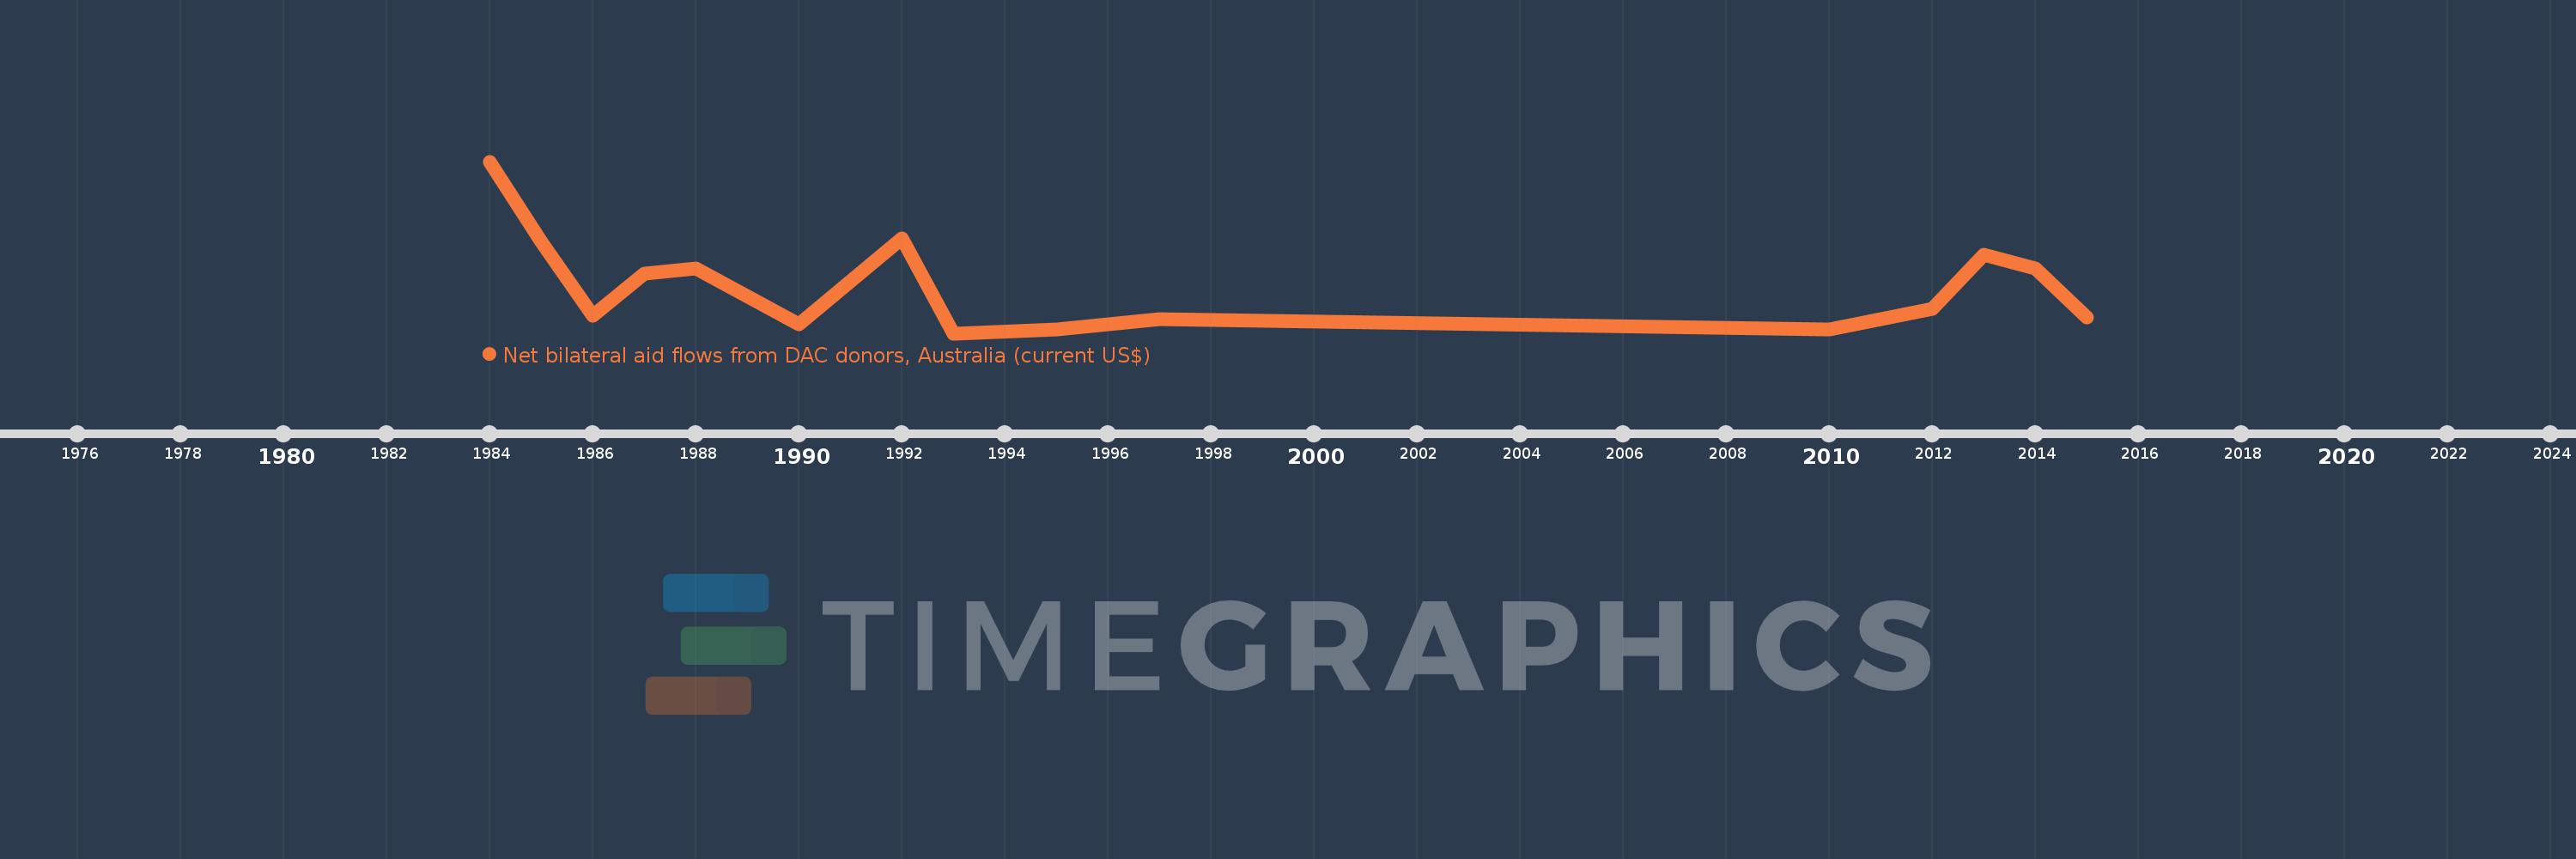
This timeline shows a graph from 1984 to 2015 of Comoros. No data until 1983. Number of actual observations by date: 15.
Source name:
World Development Indicators
Source organization:
Development Assistance Committee of the Organisation for Economic Co-operation and Development, Geographical Distribution of Financial Flows to Developing Countries, Development Co-operation Report, and International Development Statistics database. Data are available online at: www.oecd.org/dac/stats/idsonline.
Categories, topics:
Aid Effectiveness
Last updated:
apr 23, 2017
Indicators value changes by year
Meaning:
281.333K
Minimum:
10.0K
jan 1, 1993
Maximum:
990.0K
jan 1, 1984
At the date of observation
Value
Absolute change
Change from the previous value
jan 1, 1984
990.0K
+990.0K
0.0%
jan 1, 1985
530.0K
-460.0K
-46.46%
jan 1, 1986
110.0K
-420.0K
-79.25%
jan 1, 1987
350.0K
+240.0K
218.18%
jan 1, 1988
380.0K
+30.0K
8.57%
jan 1, 1990
60.0K
-320.0K
-84.21%
jan 1, 1992
550.0K
+490.0K
816.67%
jan 1, 1993
10.0K
-540.0K
-98.18%
jan 1, 1995
30.0K
+20.0K
200.0%
jan 1, 1997
90.0K
+60.0K
200.0%
jan 1, 2010
30.0K
-60.0K
-66.67%
jan 1, 2012
150.0K
+120.0K
400.0%
jan 1, 2013
460.0K
+310.0K
206.67%
jan 1, 2014
380.0K
-80.0K
-17.39%
jan 1, 2015
100.0K
-280.0K
-73.68%
Ranking of countries by current statistics by years