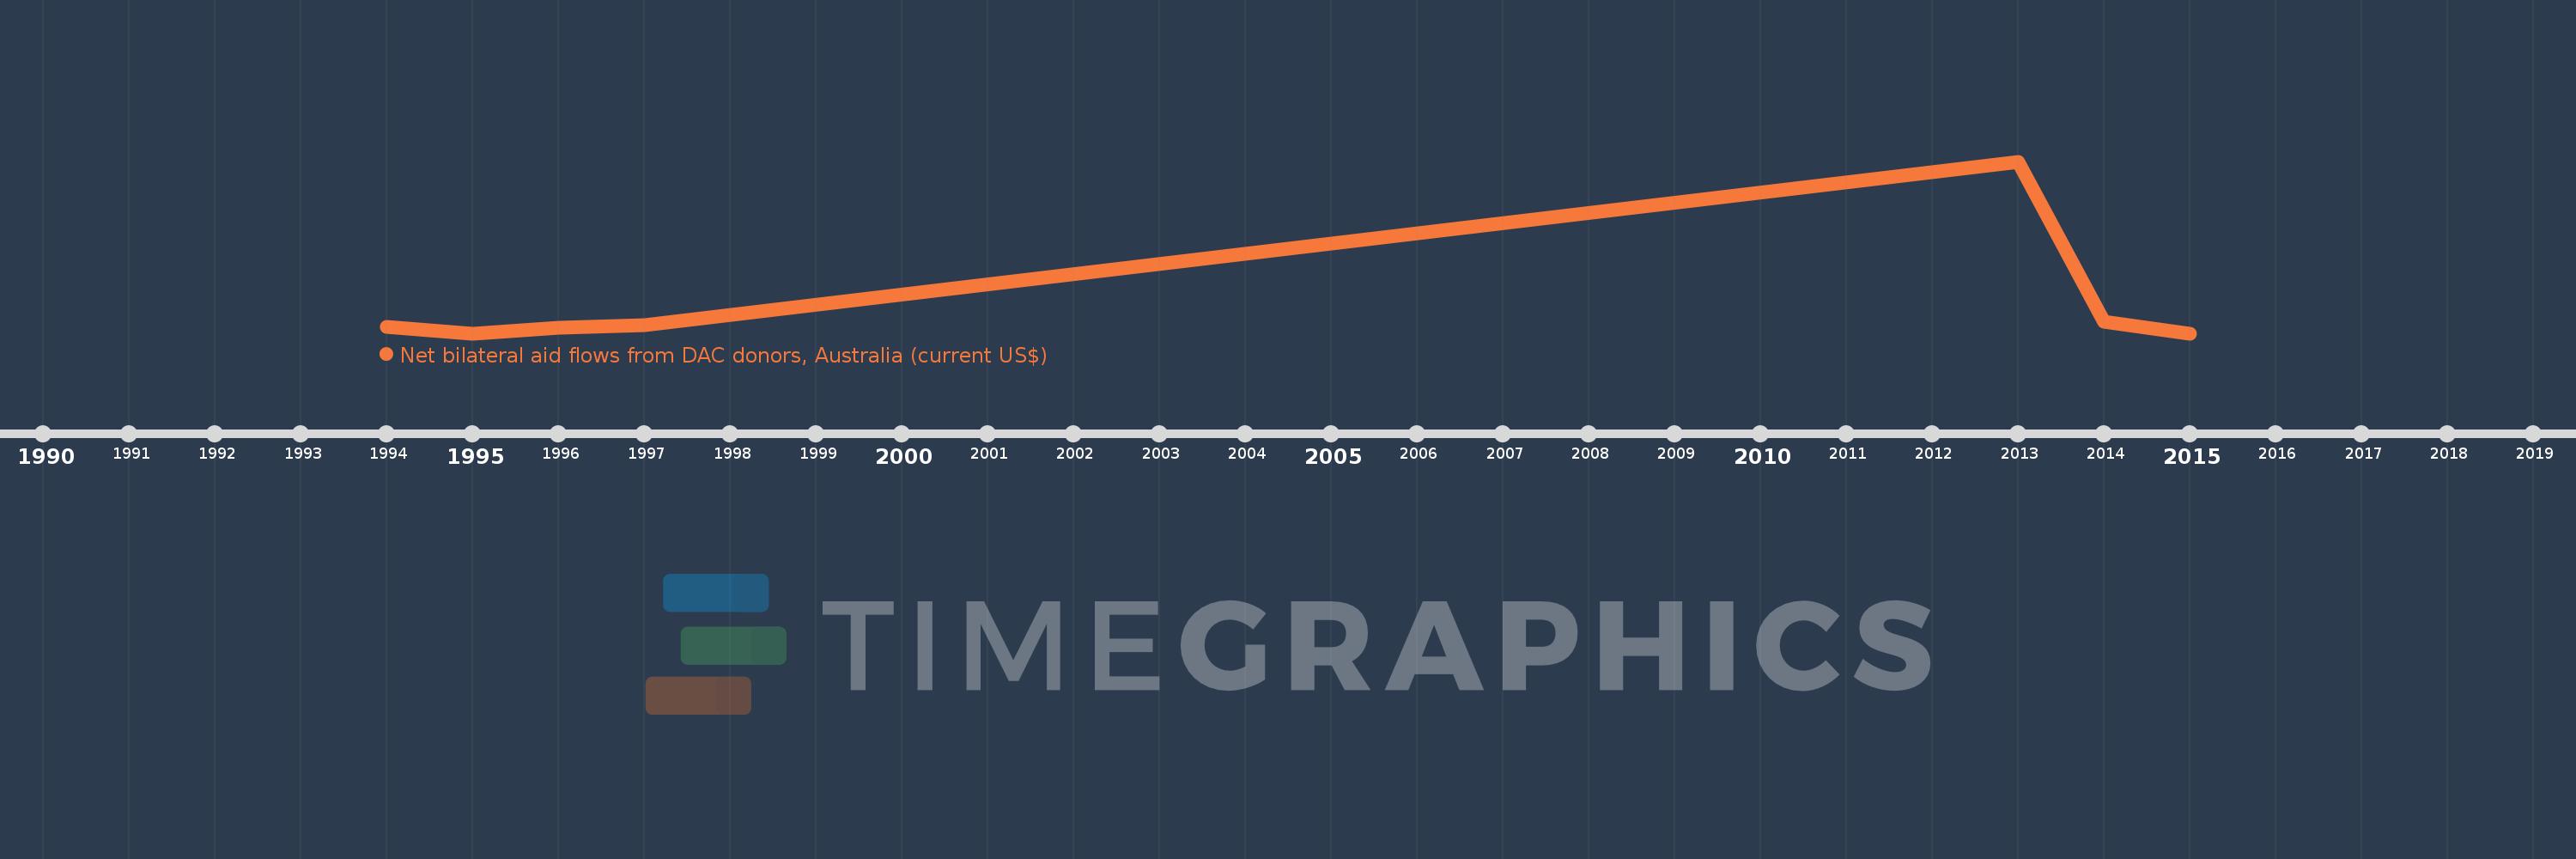
This timeline shows a graph from 1994 to 2015 of Ukraine. No data until 1993. Number of actual observations by date: 7.
Source name:
World Development Indicators
Source organization:
Development Assistance Committee of the Organisation for Economic Co-operation and Development, Geographical Distribution of Financial Flows to Developing Countries, Development Co-operation Report, and International Development Statistics database. Data are available online at: www.oecd.org/dac/stats/idsonline.
Categories, topics:
Aid Effectiveness
Last updated:
apr 23, 2017
Indicators value changes by year
Meaning:
352.857K
Minimum:
20.0K
jan 1, 1995
Maximum:
2.0 mln
jan 1, 2013
At the date of observation
Value
Absolute change
Change from the previous value
jan 1, 1994
90.0K
+90.0K
0.0%
jan 1, 1995
20.0K
-70.0K
-77.78%
jan 1, 1996
80.0K
+60.0K
300.0%
jan 1, 1997
110.0K
+30.0K
37.5%
jan 1, 2013
2.0 mln
+1.89 mln
1.72K%
jan 1, 2014
150.0K
-1.85 mln
-92.5%
jan 1, 2015
20.0K
-130.0K
-86.67%
Ranking of countries by current statistics by years