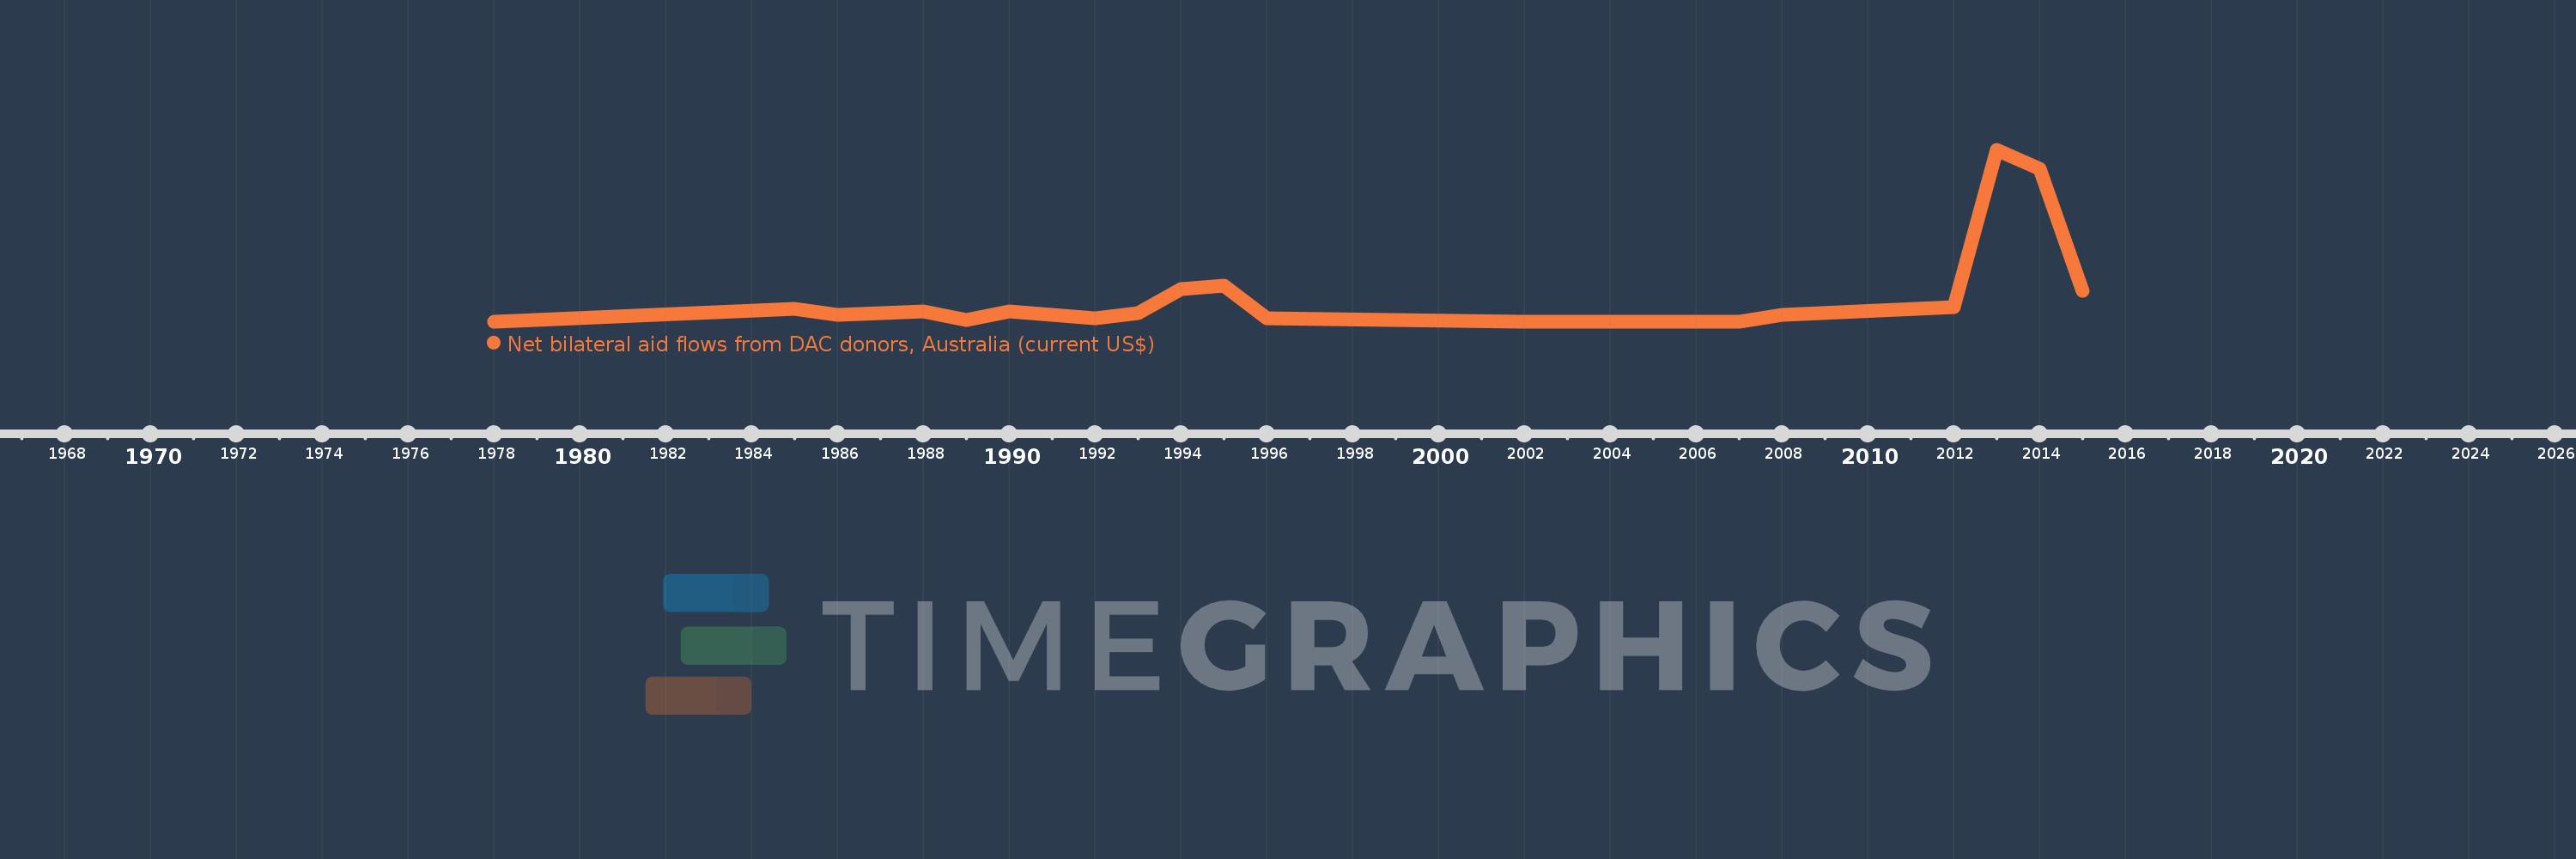
This timeline shows a graph from 1978 to 2015 of El Salvador. No data until 1977. Number of actual observations by date: 19.
Source name:
World Development Indicators
Source organization:
Development Assistance Committee of the Organisation for Economic Co-operation and Development, Geographical Distribution of Financial Flows to Developing Countries, Development Co-operation Report, and International Development Statistics database. Data are available online at: www.oecd.org/dac/stats/idsonline.
Categories, topics:
Aid Effectiveness
Last updated:
apr 23, 2017
Indicators value changes by year
Meaning:
158.947K
Minimum:
10.0K
jan 1, 1978
Maximum:
950.0K
jan 1, 2013
At the date of observation
Value
Absolute change
Change from the previous value
jan 1, 1978
10.0K
+10.0K
0.0%
jan 1, 1985
80.0K
+70.0K
700.0%
jan 1, 1986
50.0K
-30.0K
-37.5%
jan 1, 1987
60.0K
+10.0K
20.0%
jan 1, 1988
70.0K
+10.0K
16.67%
jan 1, 1989
20.0K
-50.0K
-71.43%
jan 1, 1990
70.0K
+50.0K
250.0%
jan 1, 1992
30.0K
-40.0K
-57.14%
jan 1, 1993
60.0K
+30.0K
100.0%
jan 1, 1994
190.0K
+130.0K
216.67%
jan 1, 1995
210.0K
+20.0K
10.53%
jan 1, 1996
30.0K
-180.0K
-85.71%
jan 1, 2002
10.0K
-20.0K
-66.67%
jan 1, 2007
10.0K
0.0
0.0%
jan 1, 2008
50.0K
+40.0K
400.0%
jan 1, 2012
90.0K
+40.0K
80.0%
jan 1, 2013
950.0K
+860.0K
955.56%
jan 1, 2014
850.0K
-100.0K
-10.53%
jan 1, 2015
180.0K
-670.0K
-78.82%
Ranking of countries by current statistics by years