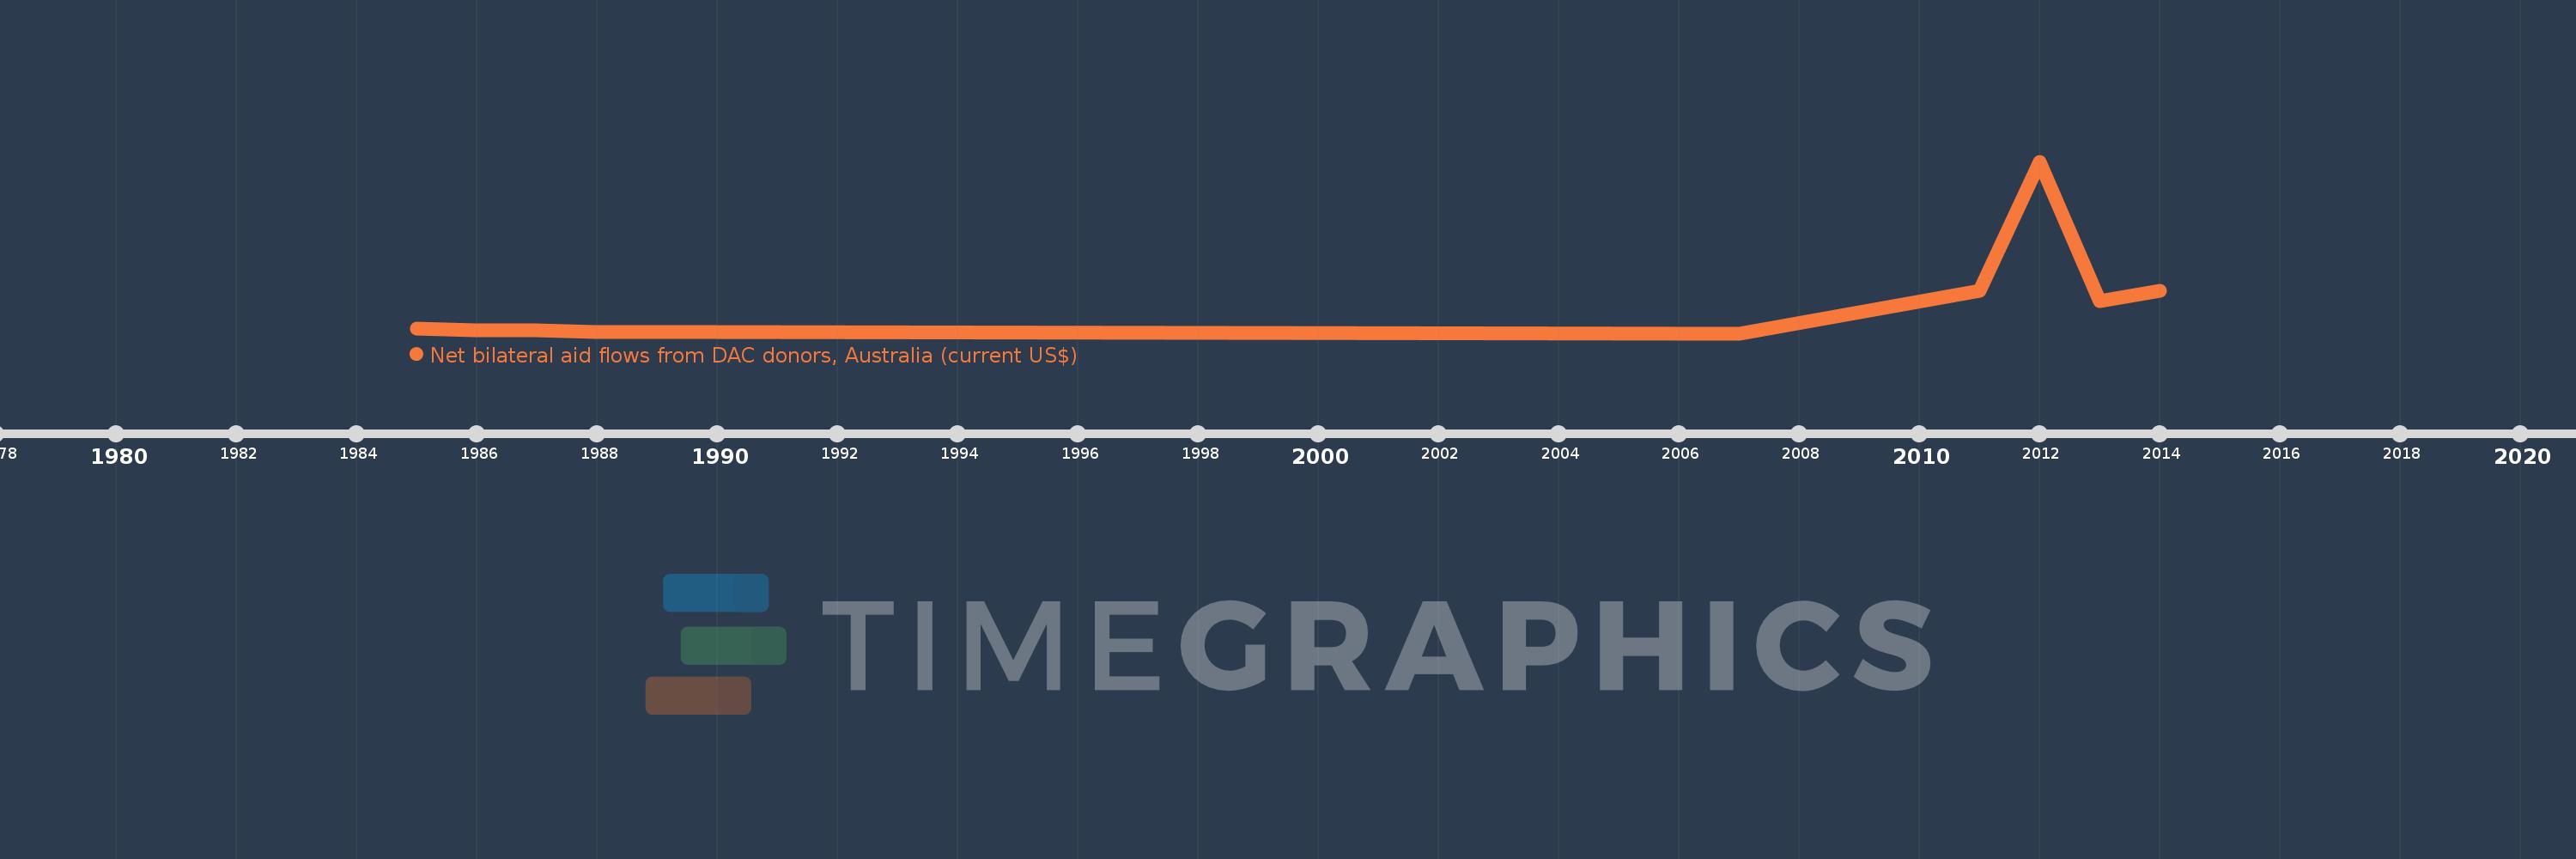
This timeline shows a graph from 1985 to 2014 of St. Kitts and Nevis. No data until 1984. Number of actual observations by date: 11.
Source name:
World Development Indicators
Source organization:
Development Assistance Committee of the Organisation for Economic Co-operation and Development, Geographical Distribution of Financial Flows to Developing Countries, Development Co-operation Report, and International Development Statistics database. Data are available online at: www.oecd.org/dac/stats/idsonline.
Categories, topics:
Aid Effectiveness
Last updated:
apr 23, 2017
Indicators value changes by year
Meaning:
173.636K
Minimum:
10.0K
jan 1, 2007
Maximum:
1.02 mln
jan 1, 2012
At the date of observation
Value
Absolute change
Change from the previous value
jan 1, 1985
40.0K
+40.0K
0.0%
jan 1, 1986
30.0K
-10.0K
-25.0%
jan 1, 1987
30.0K
0.0
0.0%
jan 1, 1988
20.0K
-10.0K
-33.33%
jan 1, 1989
20.0K
0.0
0.0%
jan 1, 1990
20.0K
0.0
0.0%
jan 1, 2007
10.0K
-10.0K
-50.0%
jan 1, 2011
260.0K
+250.0K
2.5K%
jan 1, 2012
1.02 mln
+760.0K
292.31%
jan 1, 2013
200.0K
-820.0K
-80.39%
jan 1, 2014
260.0K
+60.0K
30.0%
Ranking of countries by current statistics by years