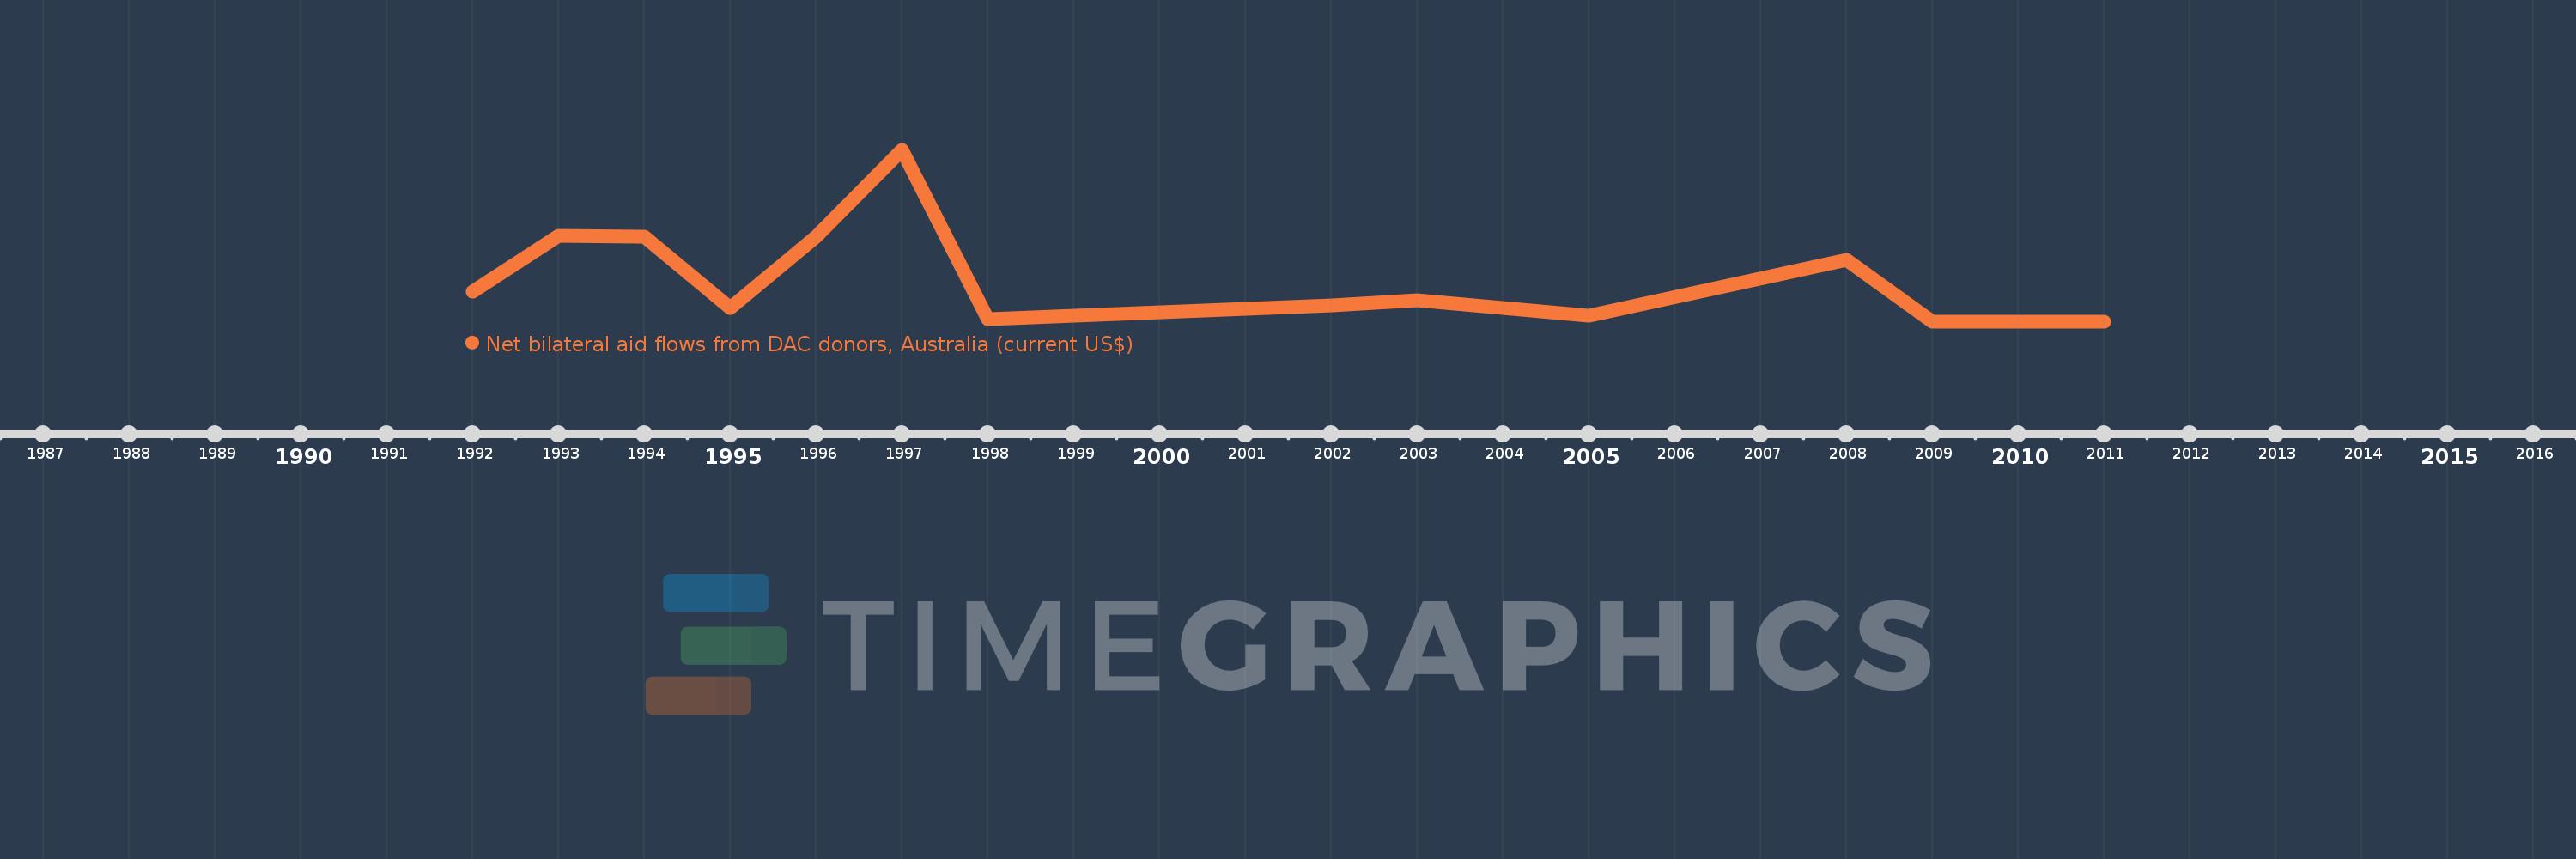
This timeline shows a graph from 1992 to 2011 of Central Europe and the Baltics. No data until 1991. Number of actual observations by date: 15.
Source name:
World Development Indicators
Source organization:
Development Assistance Committee of the Organisation for Economic Co-operation and Development, Geographical Distribution of Financial Flows to Developing Countries, Development Co-operation Report, and International Development Statistics database. Data are available online at: www.oecd.org/dac/stats/idsonline.
Categories, topics:
Aid Effectiveness
Last updated:
apr 23, 2017
Indicators value changes by year
Meaning:
536.0K
Minimum:
10.0K
jan 1, 2009
Maximum:
2.28 mln
jan 1, 1997
At the date of observation
Value
Absolute change
Change from the previous value
jan 1, 1992
410.0K
+410.0K
0.0%
jan 1, 1993
1.15 mln
+740.0K
180.49%
jan 1, 1994
1.14 mln
-10.0K
-0.87%
jan 1, 1995
200.0K
-940.0K
-82.46%
jan 1, 1996
1.14 mln
+940.0K
470.0%
jan 1, 1997
2.28 mln
+1.14 mln
100.0%
jan 1, 1998
50.0K
-2.23 mln
-97.81%
jan 1, 2002
230.0K
+180.0K
360.0%
jan 1, 2003
300.0K
+70.0K
30.43%
jan 1, 2004
190.0K
-110.0K
-36.67%
jan 1, 2005
90.0K
-100.0K
-52.63%
jan 1, 2008
830.0K
+740.0K
822.22%
jan 1, 2009
10.0K
-820.0K
-98.8%
jan 1, 2010
10.0K
0.0
0.0%
jan 1, 2011
10.0K
0.0
0.0%
Ranking of countries by current statistics by years