33
/
AIzaSyB4mHJ5NPEv-XzF7P6NDYXjlkCWaeKw5bc
November 1, 2025
213899
Northern Mariana Islands
MNP
true
2
1
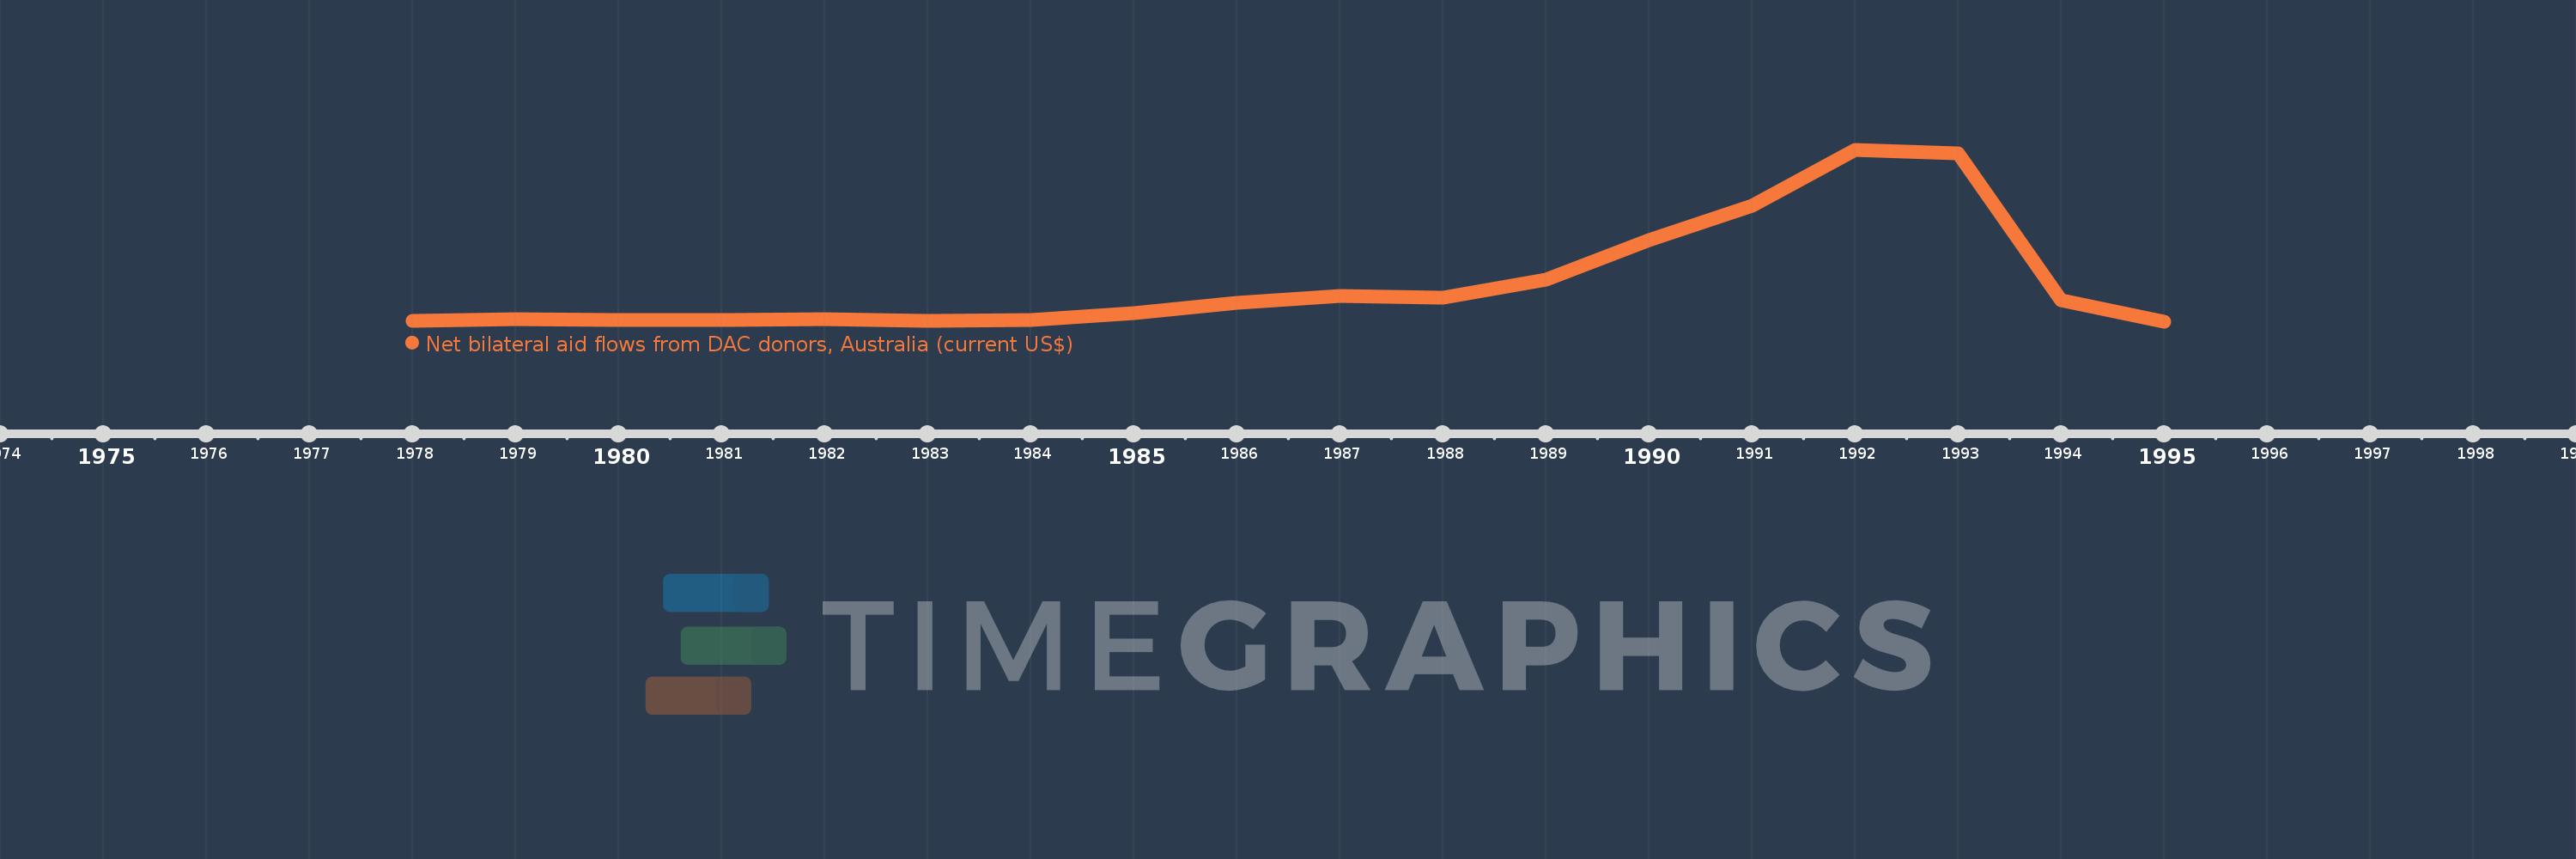
Net bilateral aid flows from DAC donors, Australia (current US$)
1995,1994,1993,1992,1991,1990,1989,1988,1987,1986,1985,1984,1983,1982,1981,1980,1979,1978