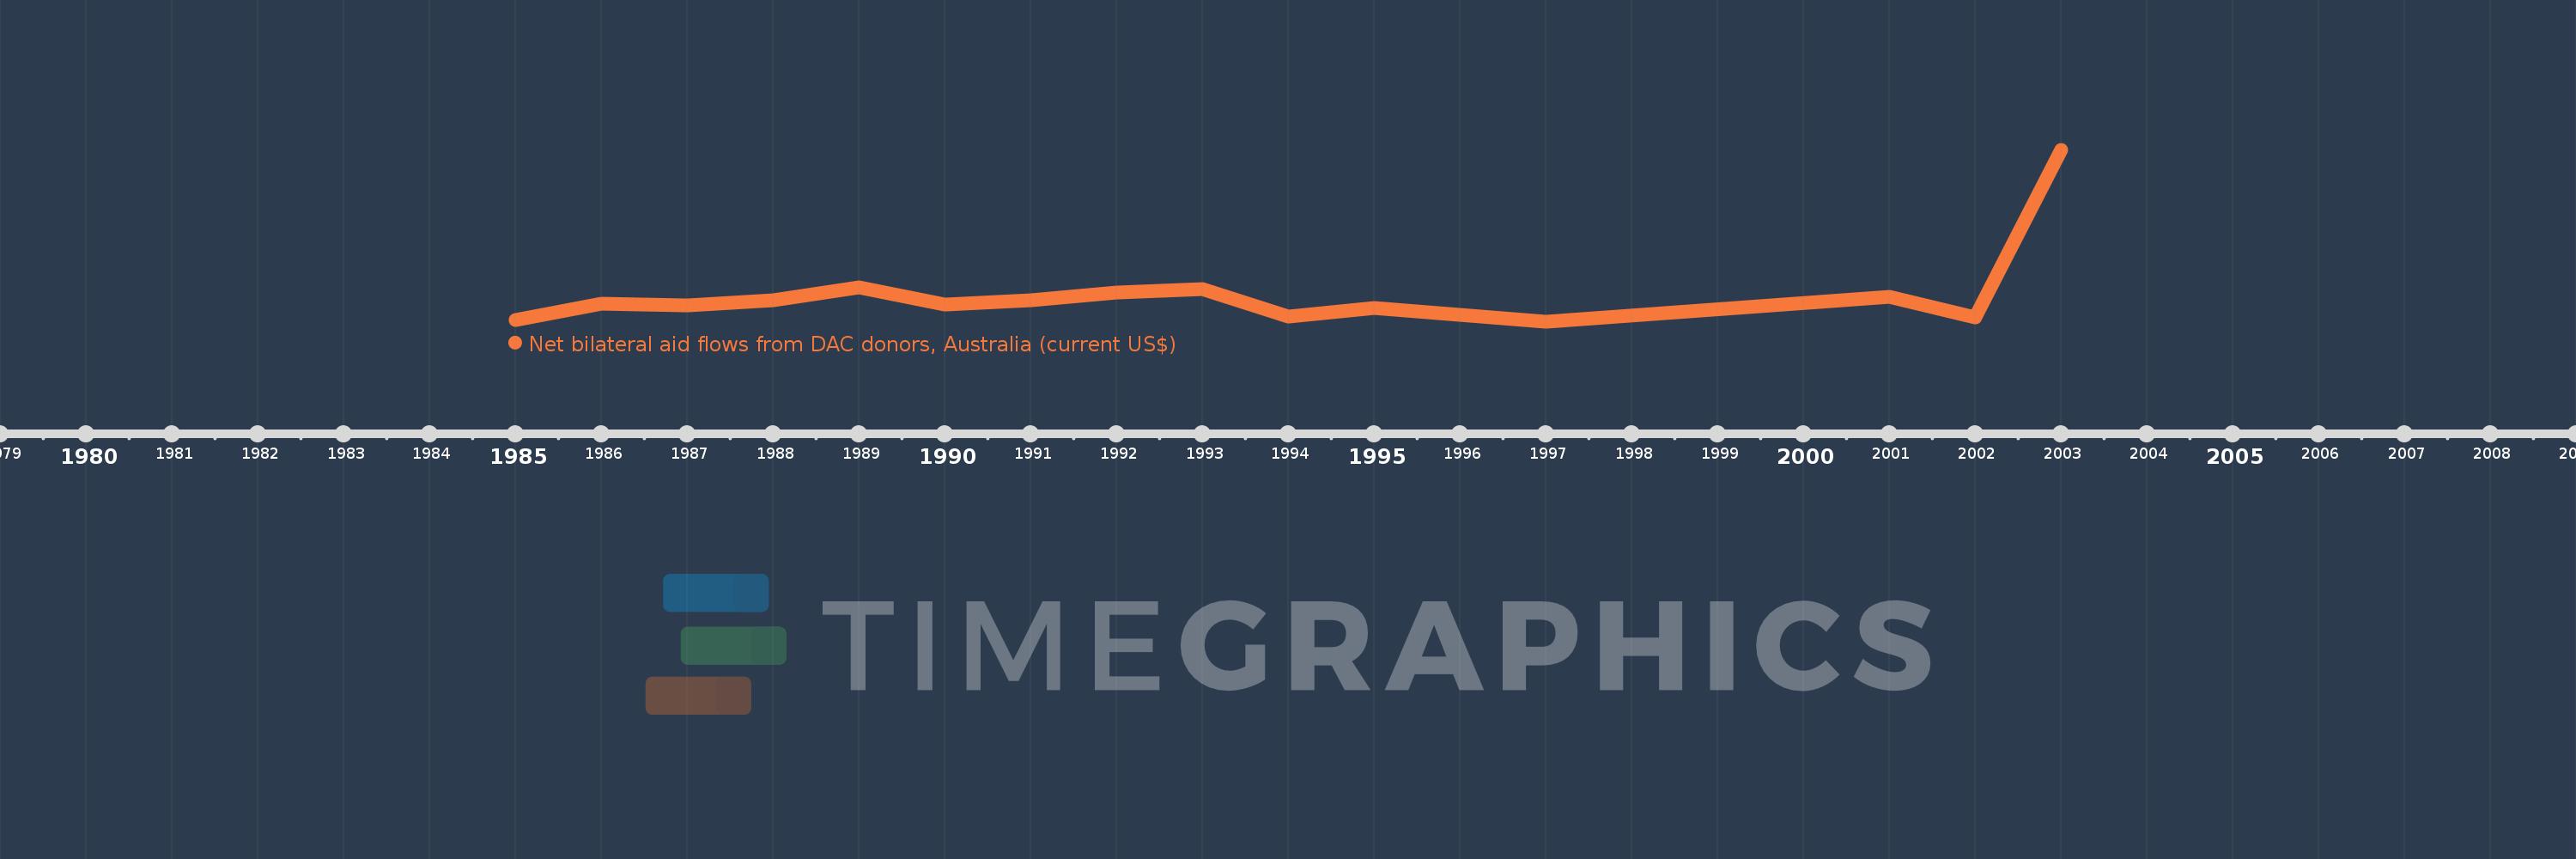
This timeline shows a graph from 1985 to 2003 of Brunei Darussalam. No data until 1984. Number of actual observations by date: 15.
Source name:
World Development Indicators
Source organization:
Development Assistance Committee of the Organisation for Economic Co-operation and Development, Geographical Distribution of Financial Flows to Developing Countries, Development Co-operation Report, and International Development Statistics database. Data are available online at: www.oecd.org/dac/stats/idsonline.
Categories, topics:
Aid Effectiveness
Last updated:
apr 23, 2017
Indicators value changes by year
Meaning:
284.667K
Minimum:
30.0K
jan 1, 1997
Maximum:
1.61 mln
jan 1, 2003
At the date of observation
Value
Absolute change
Change from the previous value
jan 1, 1985
50.0K
+50.0K
0.0%
jan 1, 1986
200.0K
+150.0K
300.0%
jan 1, 1987
180.0K
-20.0K
-10.0%
jan 1, 1988
230.0K
+50.0K
27.78%
jan 1, 1989
350.0K
+120.0K
52.17%
jan 1, 1990
190.0K
-160.0K
-45.71%
jan 1, 1991
230.0K
+40.0K
21.05%
jan 1, 1992
300.0K
+70.0K
30.43%
jan 1, 1993
330.0K
+30.0K
10.0%
jan 1, 1994
80.0K
-250.0K
-75.76%
jan 1, 1995
160.0K
+80.0K
100.0%
jan 1, 1997
30.0K
-130.0K
-81.25%
jan 1, 2001
260.0K
+230.0K
766.67%
jan 1, 2002
70.0K
-190.0K
-73.08%
jan 1, 2003
1.61 mln
+1.54 mln
2.2K%
Ranking of countries by current statistics by years