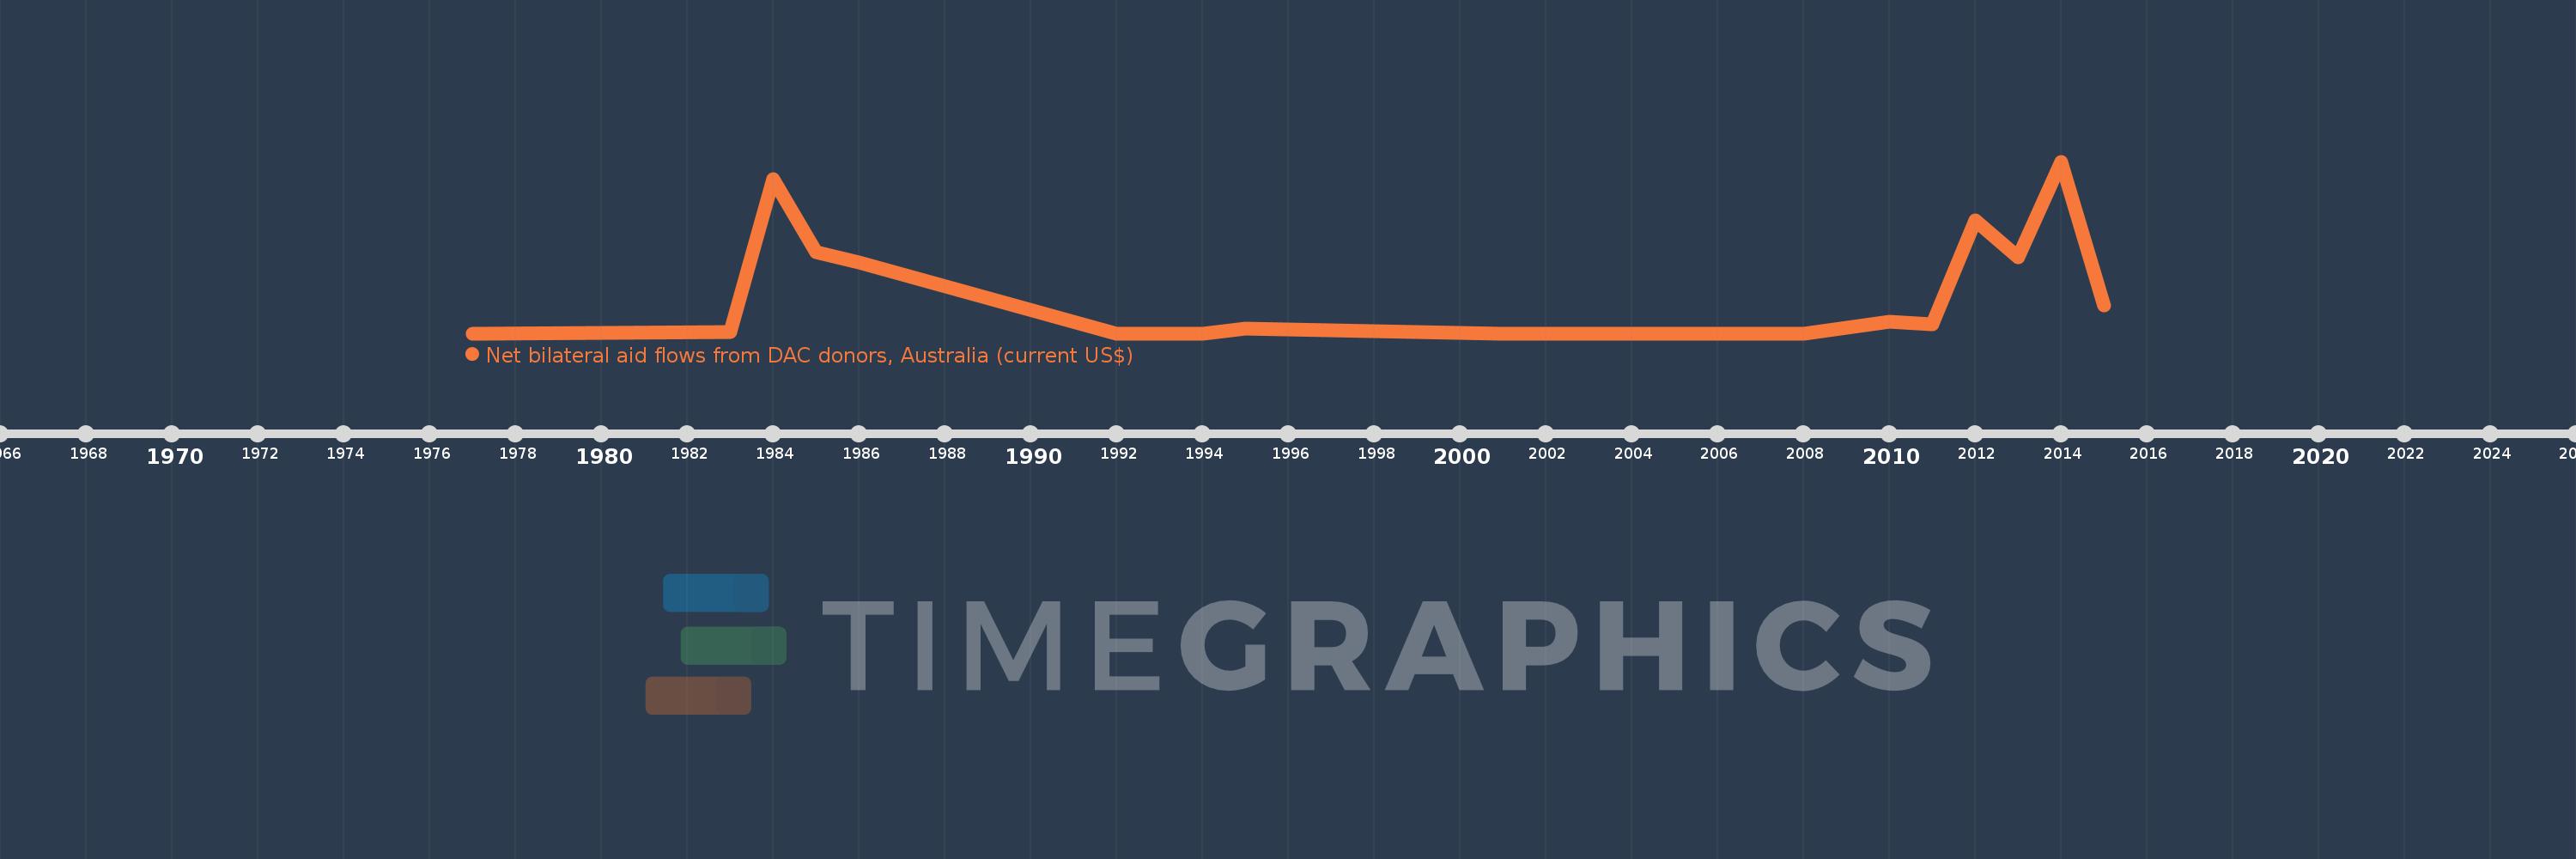
This timeline shows a graph from 1977 to 2015 of Madagascar. No data until 1976. Number of actual observations by date: 17.
Source name:
World Development Indicators
Source organization:
Development Assistance Committee of the Organisation for Economic Co-operation and Development, Geographical Distribution of Financial Flows to Developing Countries, Development Co-operation Report, and International Development Statistics database. Data are available online at: www.oecd.org/dac/stats/idsonline.
Categories, topics:
Aid Effectiveness
Last updated:
apr 23, 2017
Indicators value changes by year
Meaning:
298.824K
Minimum:
10.0K
jan 1, 1977
Maximum:
1.18 mln
jan 1, 2014
At the date of observation
Value
Absolute change
Change from the previous value
jan 1, 1977
10.0K
+10.0K
0.0%
jan 1, 1983
20.0K
+10.0K
100.0%
jan 1, 1984
1.06 mln
+1.04 mln
5.2K%
jan 1, 1985
560.0K
-500.0K
-47.17%
jan 1, 1986
490.0K
-70.0K
-12.5%
jan 1, 1992
10.0K
-480.0K
-97.96%
jan 1, 1993
10.0K
0.0
0.0%
jan 1, 1994
10.0K
0.0
0.0%
jan 1, 1995
40.0K
+30.0K
300.0%
jan 1, 2001
10.0K
-30.0K
-75.0%
jan 1, 2008
10.0K
0.0
0.0%
jan 1, 2010
90.0K
+80.0K
800.0%
jan 1, 2011
70.0K
-20.0K
-22.22%
jan 1, 2012
780.0K
+710.0K
1.01K%
jan 1, 2013
530.0K
-250.0K
-32.05%
jan 1, 2014
1.18 mln
+650.0K
122.64%
jan 1, 2015
200.0K
-980.0K
-83.05%
Ranking of countries by current statistics by years