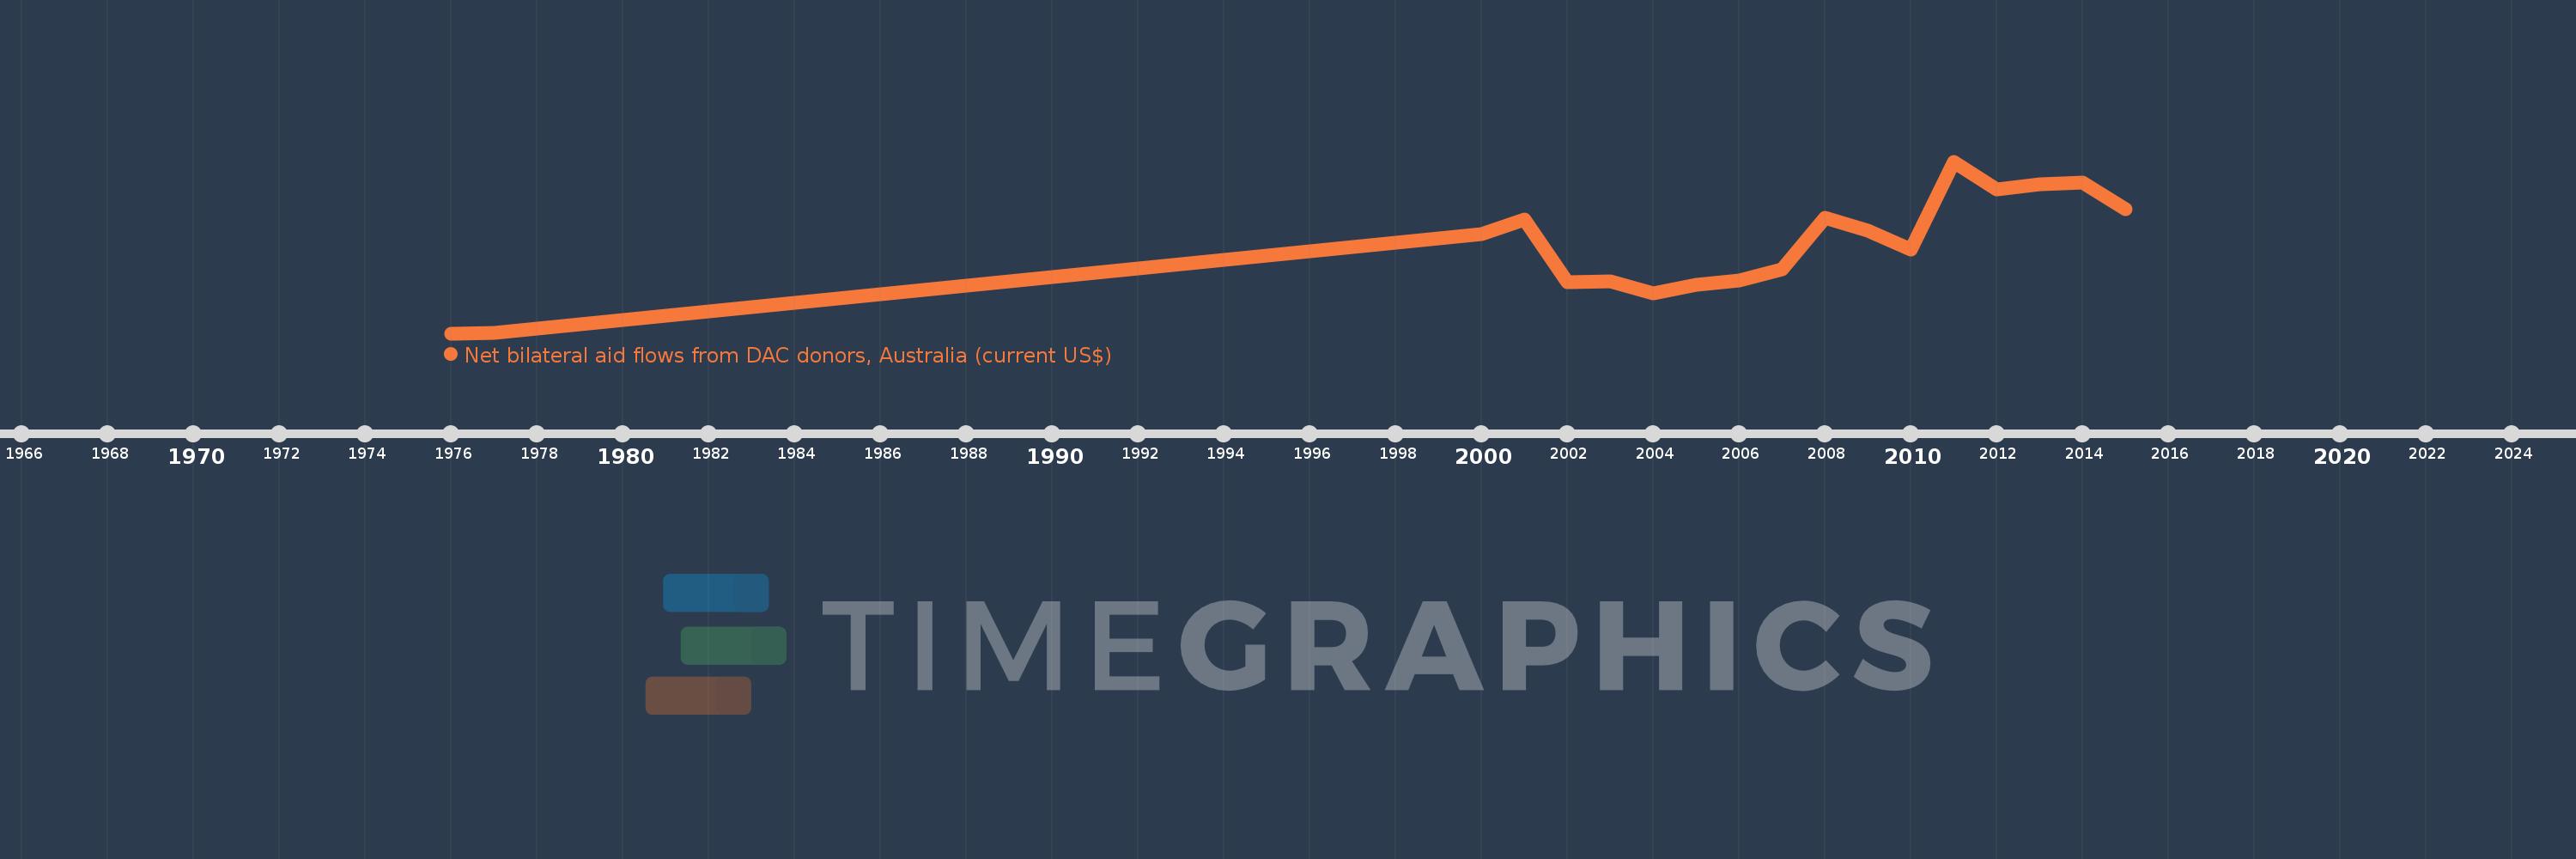
This timeline shows a graph from 1976 to 2015 of Timor-Leste. No data until 1975. Number of actual observations by date: 18.
Source name:
World Development Indicators
Source organization:
Development Assistance Committee of the Organisation for Economic Co-operation and Development, Geographical Distribution of Financial Flows to Developing Countries, Development Co-operation Report, and International Development Statistics database. Data are available online at: www.oecd.org/dac/stats/idsonline.
Categories, topics:
Aid Effectiveness
Last updated:
apr 23, 2017
Indicators value changes by year
Meaning:
62.771 mln
Minimum:
200.0K
jan 1, 1976
Maximum:
124.01 mln
jan 1, 2011
At the date of observation
Value
Absolute change
Change from the previous value
jan 1, 1976
200.0K
+200.0K
0.0%
jan 1, 1977
430.0K
+230.0K
115.0%
jan 1, 2000
71.7 mln
+71.27 mln
16.57K%
jan 1, 2001
82.44 mln
+10.74 mln
14.98%
jan 1, 2002
37.25 mln
-45.19 mln
-54.82%
jan 1, 2003
37.52 mln
+270.0K
0.72%
jan 1, 2004
28.87 mln
-8.65 mln
-23.05%
jan 1, 2005
35.25 mln
+6.38 mln
22.1%
jan 1, 2006
38.02 mln
+2.77 mln
7.86%
jan 1, 2007
46.08 mln
+8.06 mln
21.2%
jan 1, 2008
83.35 mln
+37.27 mln
80.88%
jan 1, 2009
74.48 mln
-8.87 mln
-10.64%
jan 1, 2010
60.71 mln
-13.77 mln
-18.49%
jan 1, 2011
124.01 mln
+63.3 mln
104.27%
jan 1, 2012
103.87 mln
-20.14 mln
-16.24%
jan 1, 2013
107.48 mln
+3.61 mln
3.48%
jan 1, 2014
108.57 mln
+1.09 mln
1.01%
jan 1, 2015
89.64 mln
-18.93 mln
-17.44%
Ranking of countries by current statistics by years