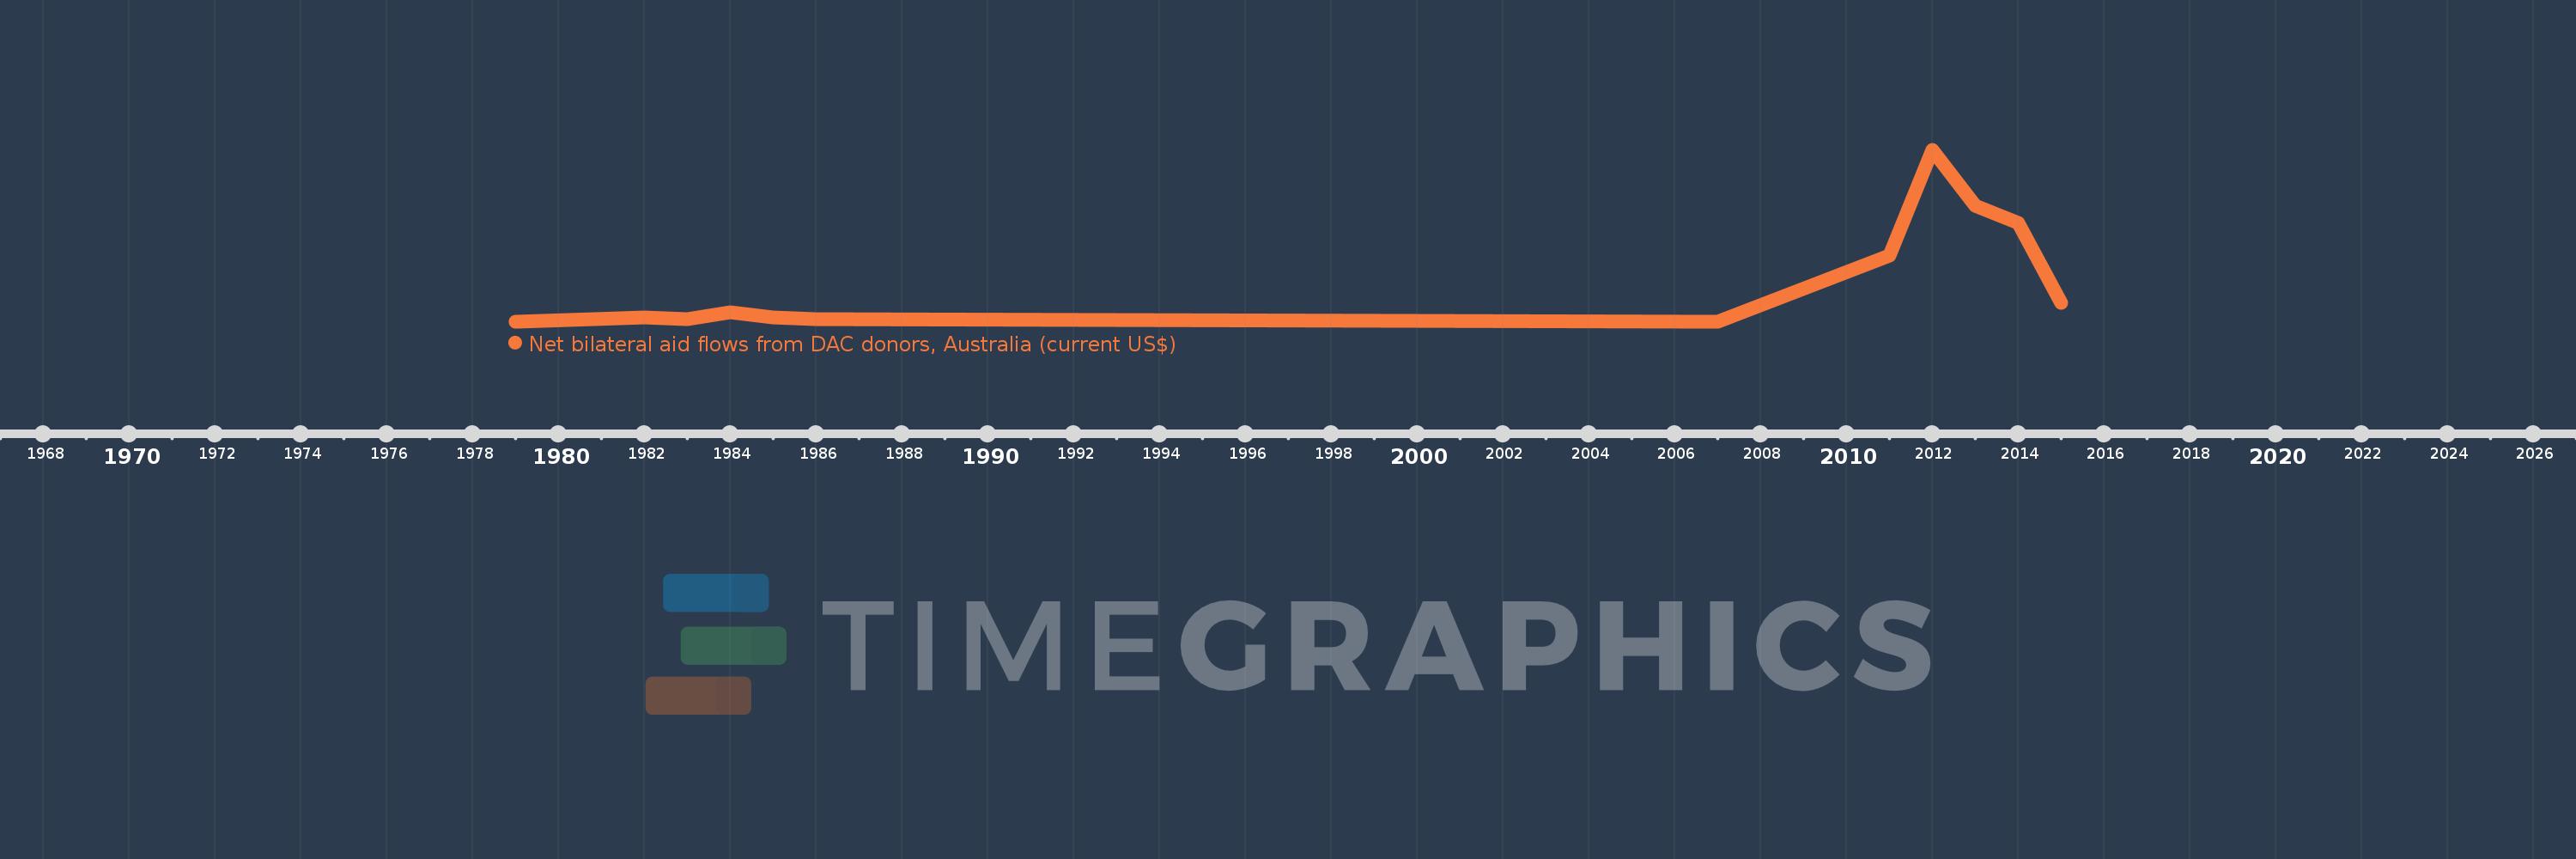
This timeline shows a graph from 1979 to 2015 of Grenada. No data until 1978. Number of actual observations by date: 12.
Source name:
World Development Indicators
Source organization:
Development Assistance Committee of the Organisation for Economic Co-operation and Development, Geographical Distribution of Financial Flows to Developing Countries, Development Co-operation Report, and International Development Statistics database. Data are available online at: www.oecd.org/dac/stats/idsonline.
Categories, topics:
Aid Effectiveness
Last updated:
apr 23, 2017
Indicators value changes by year
Meaning:
270.833K
Minimum:
10.0K
jan 1, 1979
Maximum:
1.09 mln
jan 1, 2012
At the date of observation
Value
Absolute change
Change from the previous value
jan 1, 1979
10.0K
+10.0K
0.0%
jan 1, 1982
40.0K
+30.0K
300.0%
jan 1, 1983
30.0K
-10.0K
-25.0%
jan 1, 1984
70.0K
+40.0K
133.33%
jan 1, 1985
40.0K
-30.0K
-42.86%
jan 1, 1986
30.0K
-10.0K
-25.0%
jan 1, 2007
10.0K
-20.0K
-66.67%
jan 1, 2011
430.0K
+420.0K
4.2K%
jan 1, 2012
1.09 mln
+660.0K
153.49%
jan 1, 2013
740.0K
-350.0K
-32.11%
jan 1, 2014
630.0K
-110.0K
-14.86%
jan 1, 2015
130.0K
-500.0K
-79.37%
Ranking of countries by current statistics by years