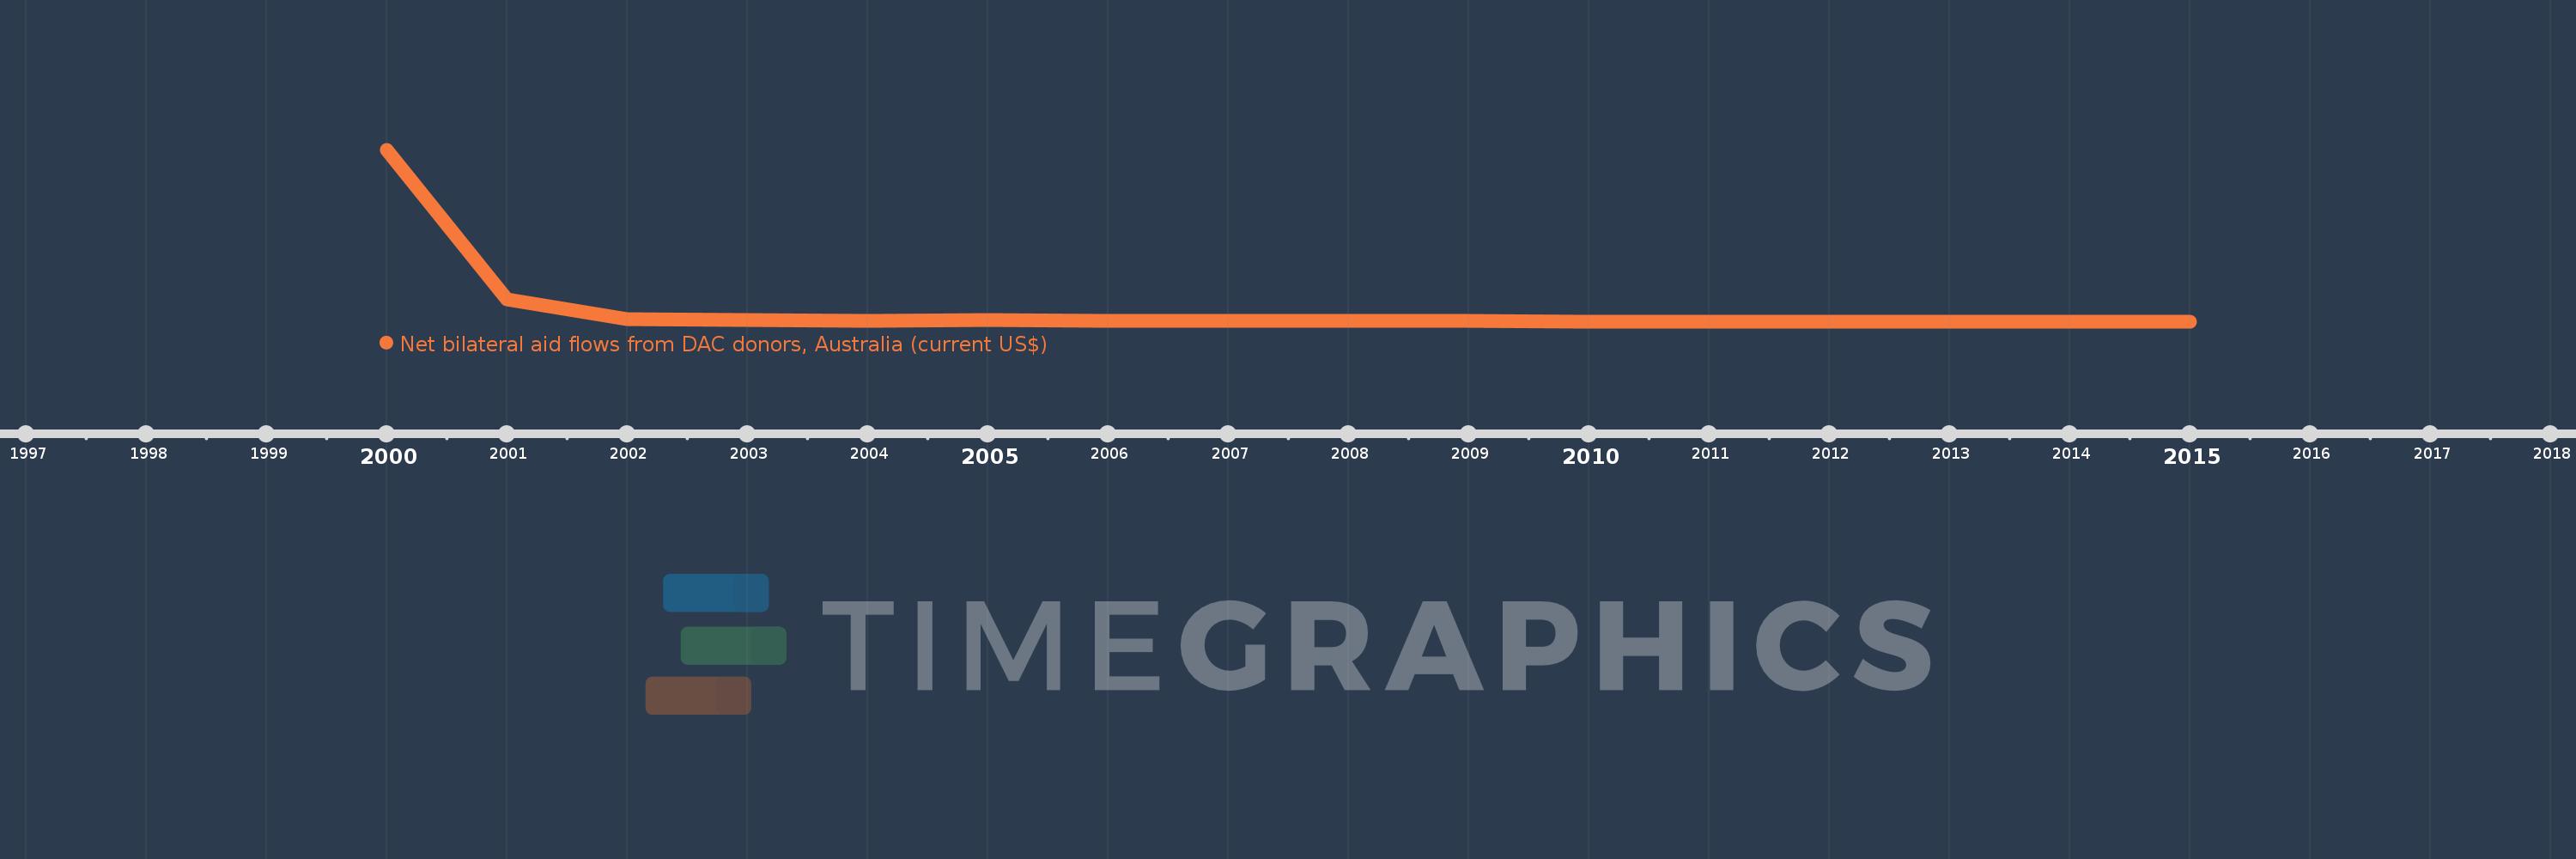
This timeline shows a graph from 2000 to 2015 of Serbia. No data until 1999. Number of actual observations by date: 13.
Source name:
World Development Indicators
Source organization:
Development Assistance Committee of the Organisation for Economic Co-operation and Development, Geographical Distribution of Financial Flows to Developing Countries, Development Co-operation Report, and International Development Statistics database. Data are available online at: www.oecd.org/dac/stats/idsonline.
Categories, topics:
Aid Effectiveness
Last updated:
apr 23, 2017
Indicators value changes by year
Meaning:
4.012 mln
Minimum:
10.0K
jan 1, 2012
Maximum:
44.18 mln
jan 1, 2000
At the date of observation
Value
Absolute change
Change from the previous value
jan 1, 2000
44.18 mln
+44.18 mln
0.0%
jan 1, 2001
5.84 mln
-38.34 mln
-86.78%
jan 1, 2002
670.0K
-5.17 mln
-88.53%
jan 1, 2004
230.0K
-440.0K
-65.67%
jan 1, 2005
460.0K
+230.0K
100.0%
jan 1, 2006
310.0K
-150.0K
-32.61%
jan 1, 2008
200.0K
-110.0K
-35.48%
jan 1, 2009
190.0K
-10.0K
-5.0%
jan 1, 2010
20.0K
-170.0K
-89.47%
jan 1, 2012
10.0K
-10.0K
-50.0%
jan 1, 2013
10.0K
0.0
0.0%
jan 1, 2014
10.0K
0.0
0.0%
jan 1, 2015
20.0K
+10.0K
100.0%
Ranking of countries by current statistics by years