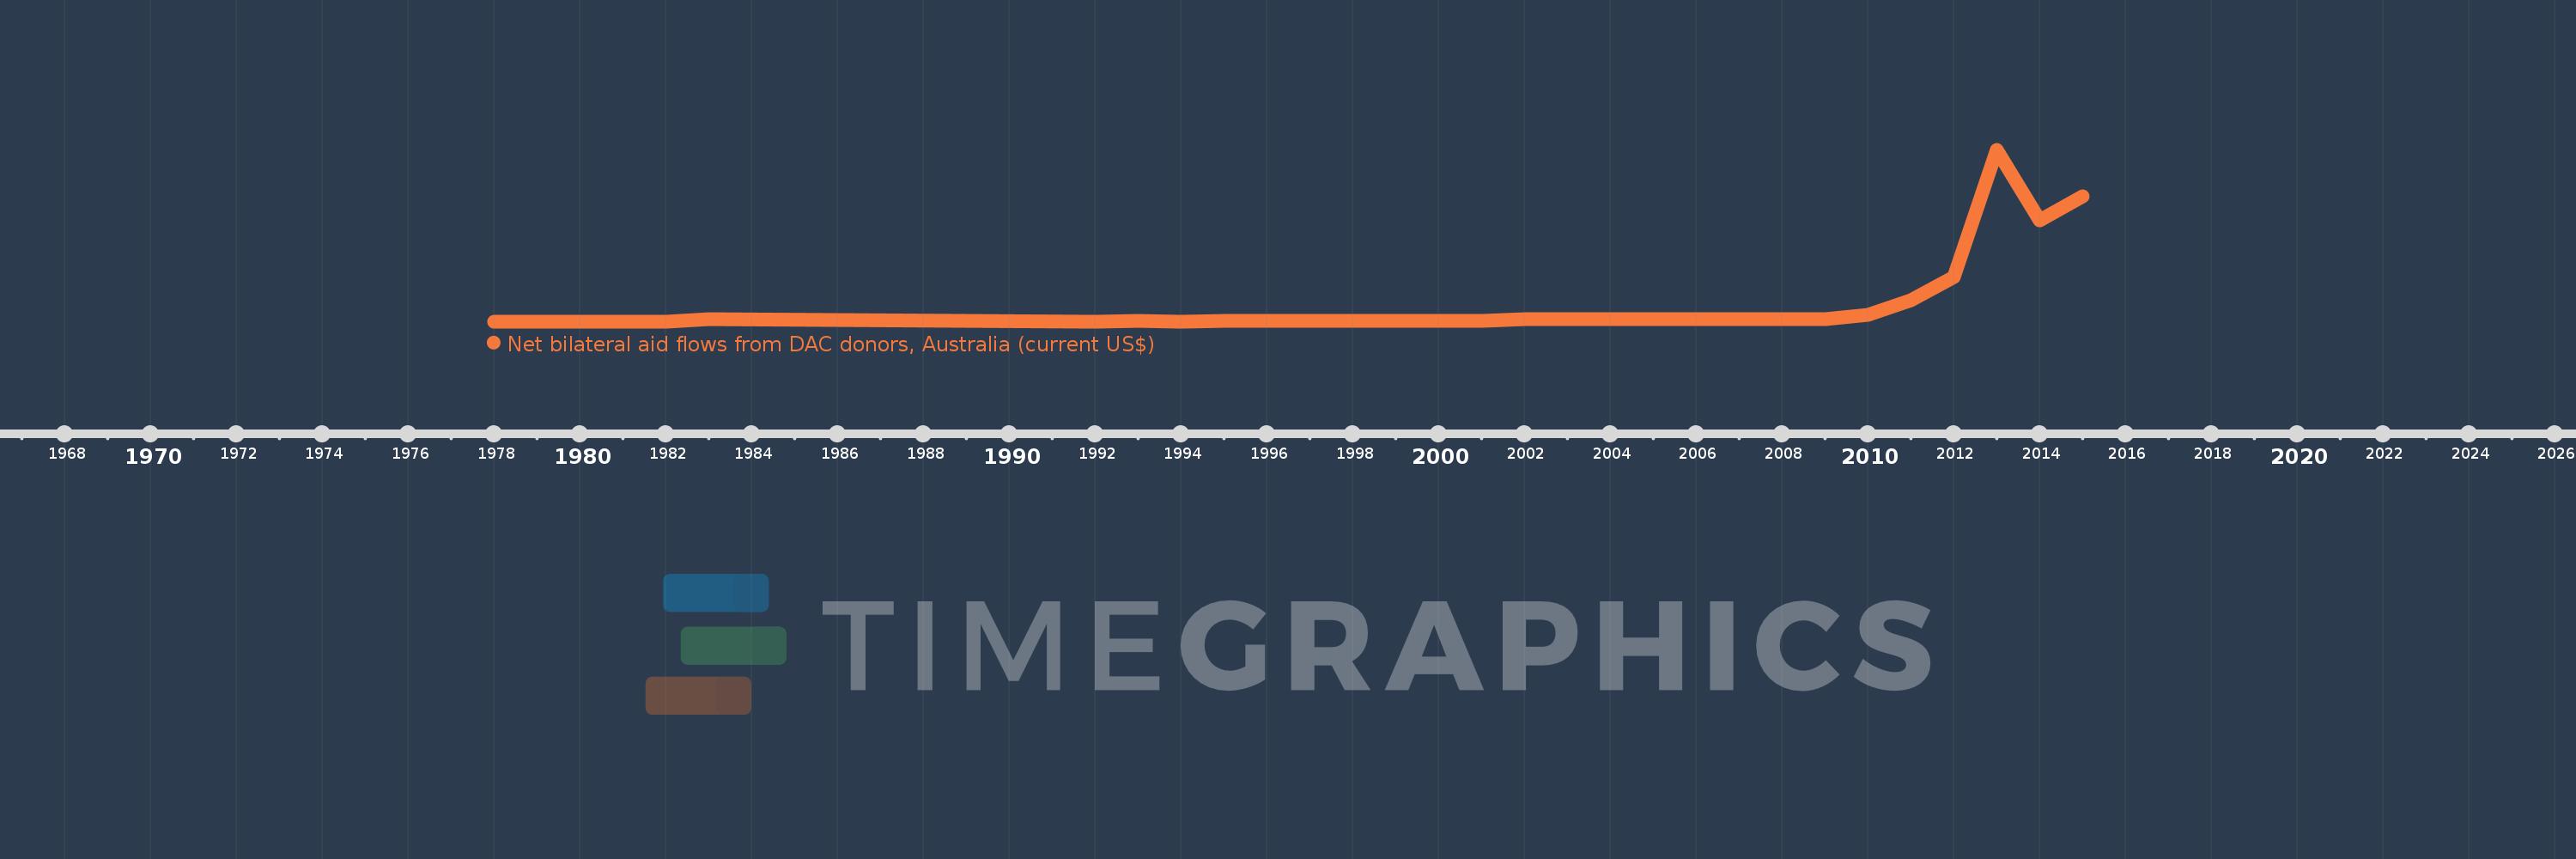
This timeline shows a graph from 1978 to 2015 of Argentina. No data until 1977. Number of actual observations by date: 18.
Source name:
World Development Indicators
Source organization:
Development Assistance Committee of the Organisation for Economic Co-operation and Development, Geographical Distribution of Financial Flows to Developing Countries, Development Co-operation Report, and International Development Statistics database. Data are available online at: www.oecd.org/dac/stats/idsonline.
Categories, topics:
Aid Effectiveness
Last updated:
apr 23, 2017
Indicators value changes by year
Meaning:
226.667K
Minimum:
10.0K
jan 1, 1978
Maximum:
1.38 mln
jan 1, 2013
At the date of observation
Value
Absolute change
Change from the previous value
jan 1, 1978
10.0K
+10.0K
0.0%
jan 1, 1982
10.0K
0.0
0.0%
jan 1, 1983
30.0K
+20.0K
200.0%
jan 1, 1992
10.0K
-20.0K
-66.67%
jan 1, 1993
20.0K
+10.0K
100.0%
jan 1, 1994
10.0K
-10.0K
-50.0%
jan 1, 1995
20.0K
+10.0K
100.0%
jan 1, 2001
20.0K
0.0
0.0%
jan 1, 2002
30.0K
+10.0K
50.0%
jan 1, 2003
30.0K
0.0
0.0%
jan 1, 2005
30.0K
0.0
0.0%
jan 1, 2009
30.0K
0.0
0.0%
jan 1, 2010
70.0K
+40.0K
133.33%
jan 1, 2011
180.0K
+110.0K
157.14%
jan 1, 2012
370.0K
+190.0K
105.56%
jan 1, 2013
1.38 mln
+1.01 mln
272.97%
jan 1, 2014
820.0K
-560.0K
-40.58%
jan 1, 2015
1.01 mln
+190.0K
23.17%
Ranking of countries by current statistics by years