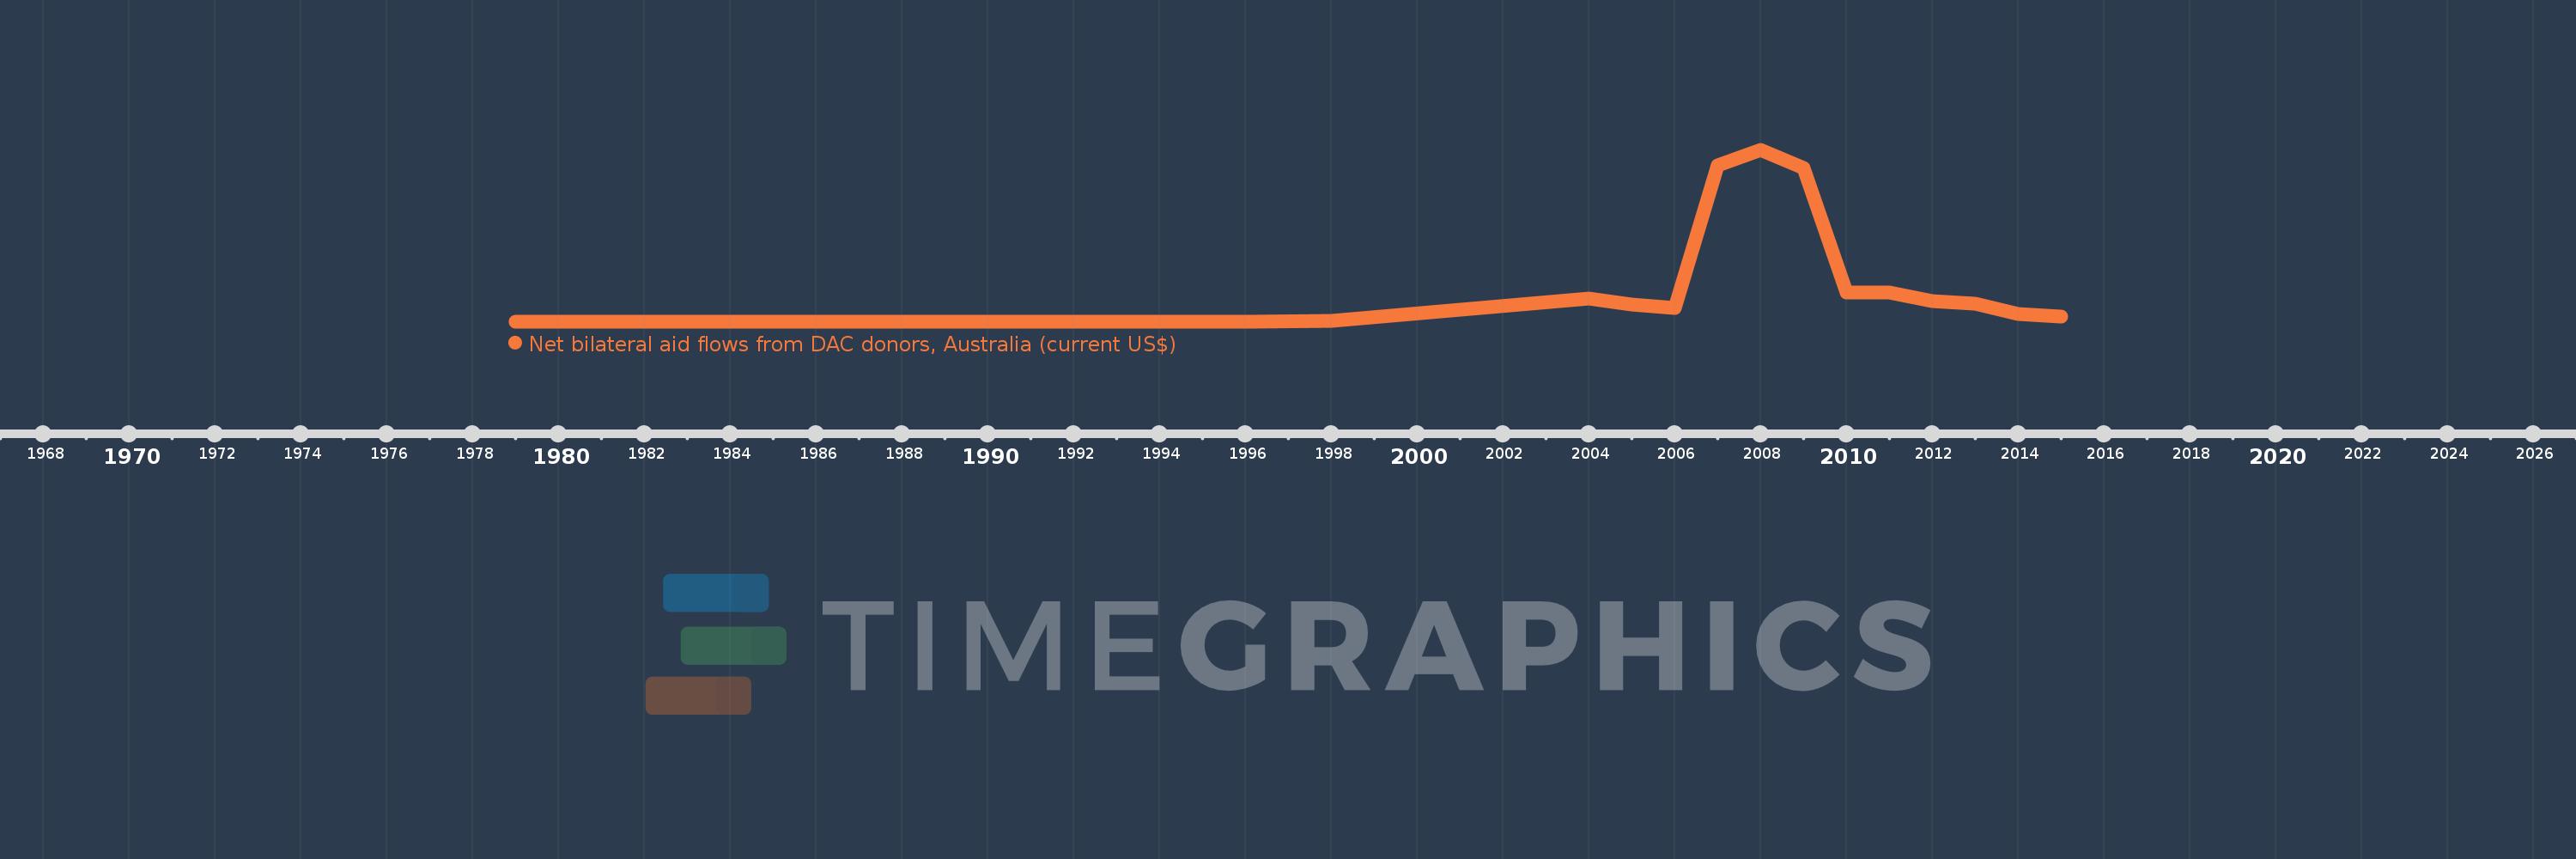
This timeline shows a graph from 1979 to 2015 of Iraq. No data until 1978. Number of actual observations by date: 21.
Source name:
World Development Indicators
Source organization:
Development Assistance Committee of the Organisation for Economic Co-operation and Development, Geographical Distribution of Financial Flows to Developing Countries, Development Co-operation Report, and International Development Statistics database. Data are available online at: www.oecd.org/dac/stats/idsonline.
Categories, topics:
Aid Effectiveness
Last updated:
apr 23, 2017
Indicators value changes by year
Meaning:
54.326 mln
Minimum:
10.0K
jan 1, 1979
Maximum:
300.62 mln
jan 1, 2008
At the date of observation
Value
Absolute change
Change from the previous value
jan 1, 1979
10.0K
+10.0K
0.0%
jan 1, 1989
130.0K
+120.0K
1.2K%
jan 1, 1990
80.0K
-50.0K
-38.46%
jan 1, 1991
60.0K
-20.0K
-25.0%
jan 1, 1992
40.0K
-20.0K
-33.33%
jan 1, 1993
240.0K
+200.0K
500.0%
jan 1, 1994
480.0K
+240.0K
100.0%
jan 1, 1996
220.0K
-260.0K
-54.17%
jan 1, 1998
1.43 mln
+1.21 mln
550.0%
jan 1, 2004
41.12 mln
+39.69 mln
2.78K%
jan 1, 2005
30.73 mln
-10.39 mln
-25.27%
jan 1, 2006
24.56 mln
-6.17 mln
-20.08%
jan 1, 2007
274.61 mln
+250.05 mln
1.02K%
jan 1, 2008
300.62 mln
+26.01 mln
9.47%
jan 1, 2009
269.93 mln
-30.69 mln
-10.21%
jan 1, 2010
52.18 mln
-217.75 mln
-80.67%
jan 1, 2011
52.22 mln
+40.0K
0.08%
jan 1, 2012
37.18 mln
-15.04 mln
-28.8%
jan 1, 2013
31.67 mln
-5.51 mln
-14.82%
jan 1, 2014
13.58 mln
-18.09 mln
-57.12%
jan 1, 2015
9.75 mln
-3.83 mln
-28.2%
Ranking of countries by current statistics by years