33
/
AIzaSyB4mHJ5NPEv-XzF7P6NDYXjlkCWaeKw5bc
November 30, 2025
162887
Jamaica
JAM
true
2
1
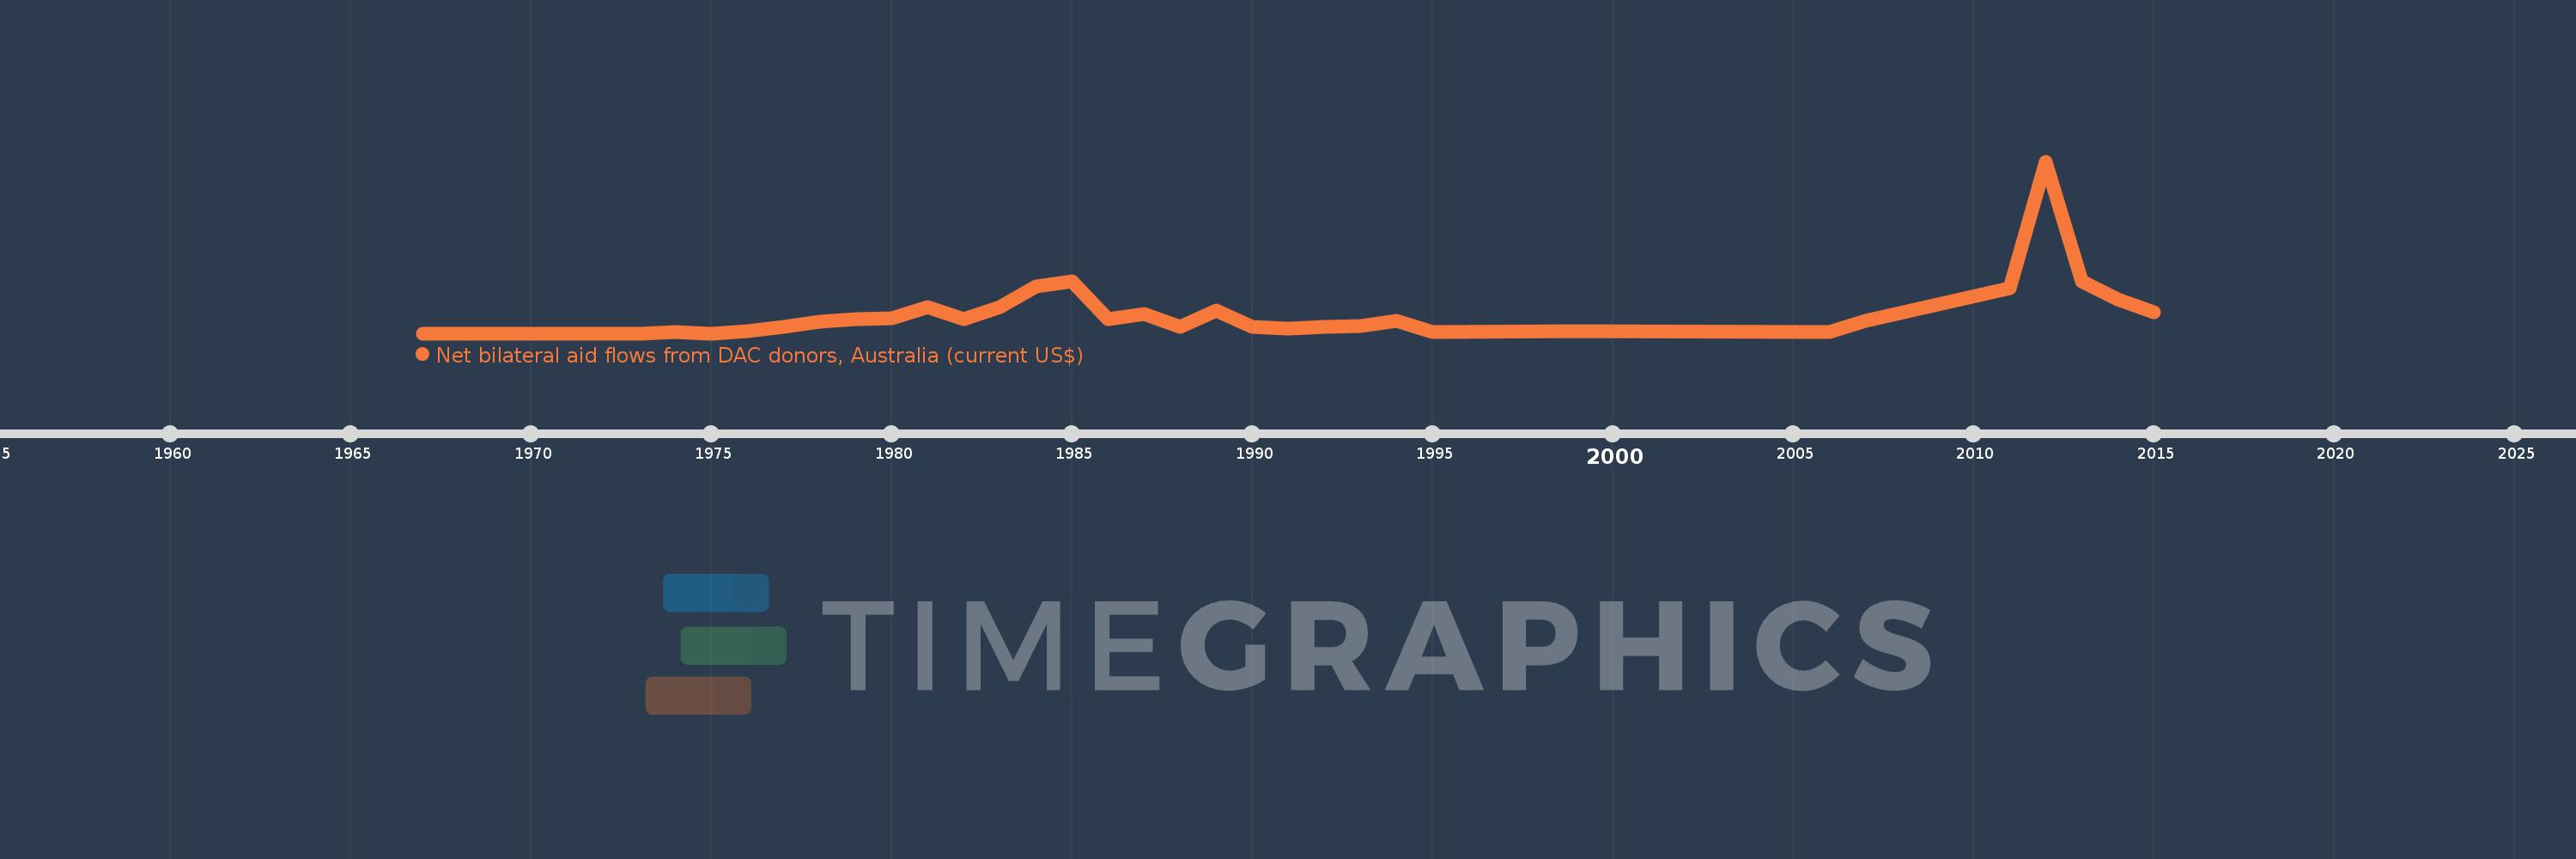
Net bilateral aid flows from DAC donors, Australia (current US$)
2015,2014,2013,2012,2011,2007,2006,1999,1995,1994,1993,1992,1991,1990,1989,1988,1987,1986,1985,1984,1983,1982,1981,1980,1979,1978,1977,1976,1975,1974,1973,1972,1970,1968,1967