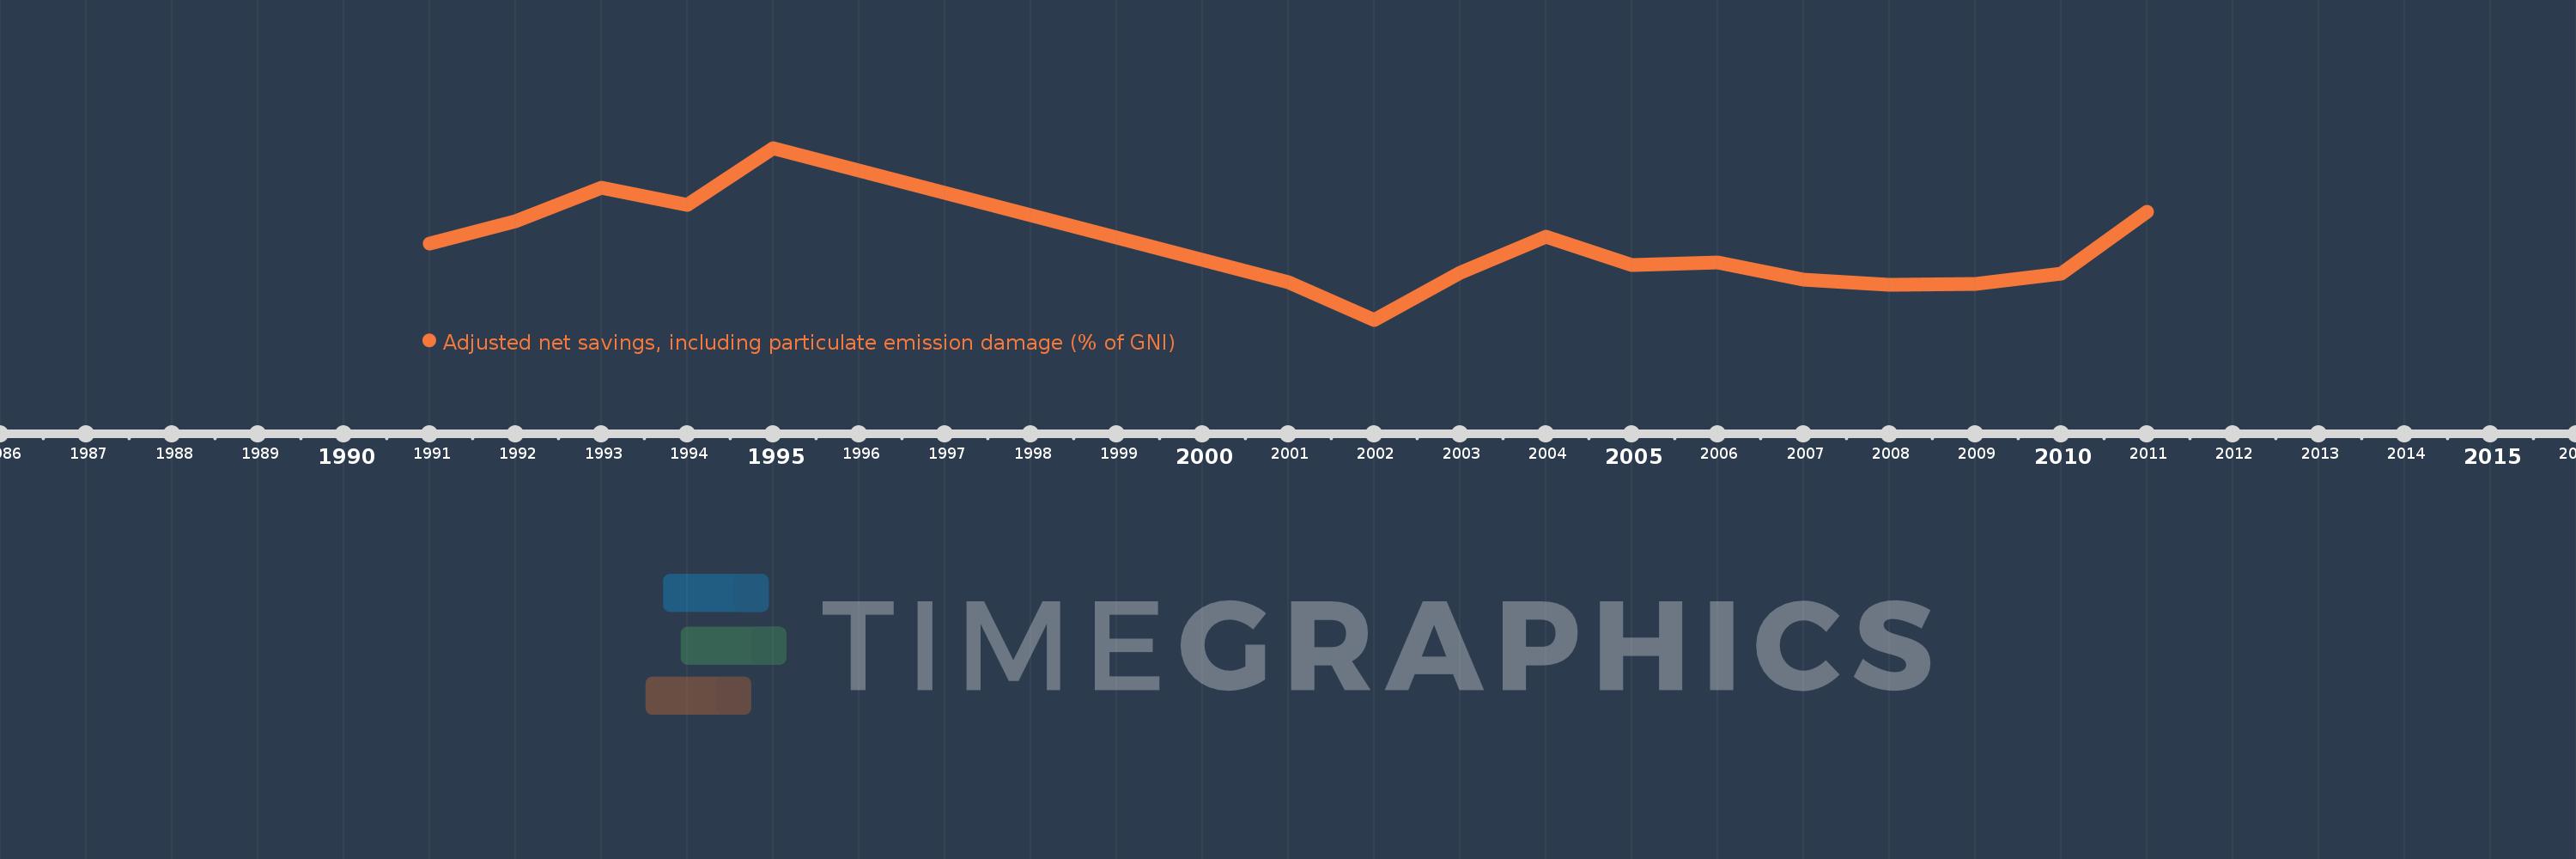
This timeline shows a graph from 1991 to 2011 of Burkina Faso. No data until 1990. Number of actual observations by date: 16.
Source name:
World Development Indicators
Source organization:
World Bank staff estimates based on sources and methods in World Bank's "The Changing Wealth of Nations: Measuring Sustainable Development in the New Millennium" (2011).
Categories, topics:
Economy & Growth, Environment
Last updated:
apr 23, 2017
Indicators value changes by year
Meaning:
5.584
Minimum:
-2.833
jan 1, 2002
Maximum:
17.493
jan 1, 1995
At the date of observation
Value
Absolute change
Change from the previous value
jan 1, 1991
6.213
+6.213
0.0%
jan 1, 1992
8.819
+2.607
41.96%
jan 1, 1993
12.809
+3.989
45.24%
jan 1, 1994
10.708
-2.1
-16.4%
jan 1, 1995
17.493
+6.784
63.35%
jan 1, 2001
1.655
-15.838
-90.54%
jan 1, 2002
-2.833
-4.487
-271.19%
jan 1, 2003
2.744
+5.576
-196.85%
jan 1, 2004
6.973
+4.229
154.16%
jan 1, 2005
3.635
-3.338
-47.87%
jan 1, 2006
3.945
+0.311
8.54%
jan 1, 2007
1.95
-1.995
-50.57%
jan 1, 2008
1.303
-0.647
-33.17%
jan 1, 2009
1.406
+0.103
7.92%
jan 1, 2010
2.601
+1.194
84.89%
jan 1, 2011
9.916
+7.316
281.31%
Ranking of countries by current statistics by years