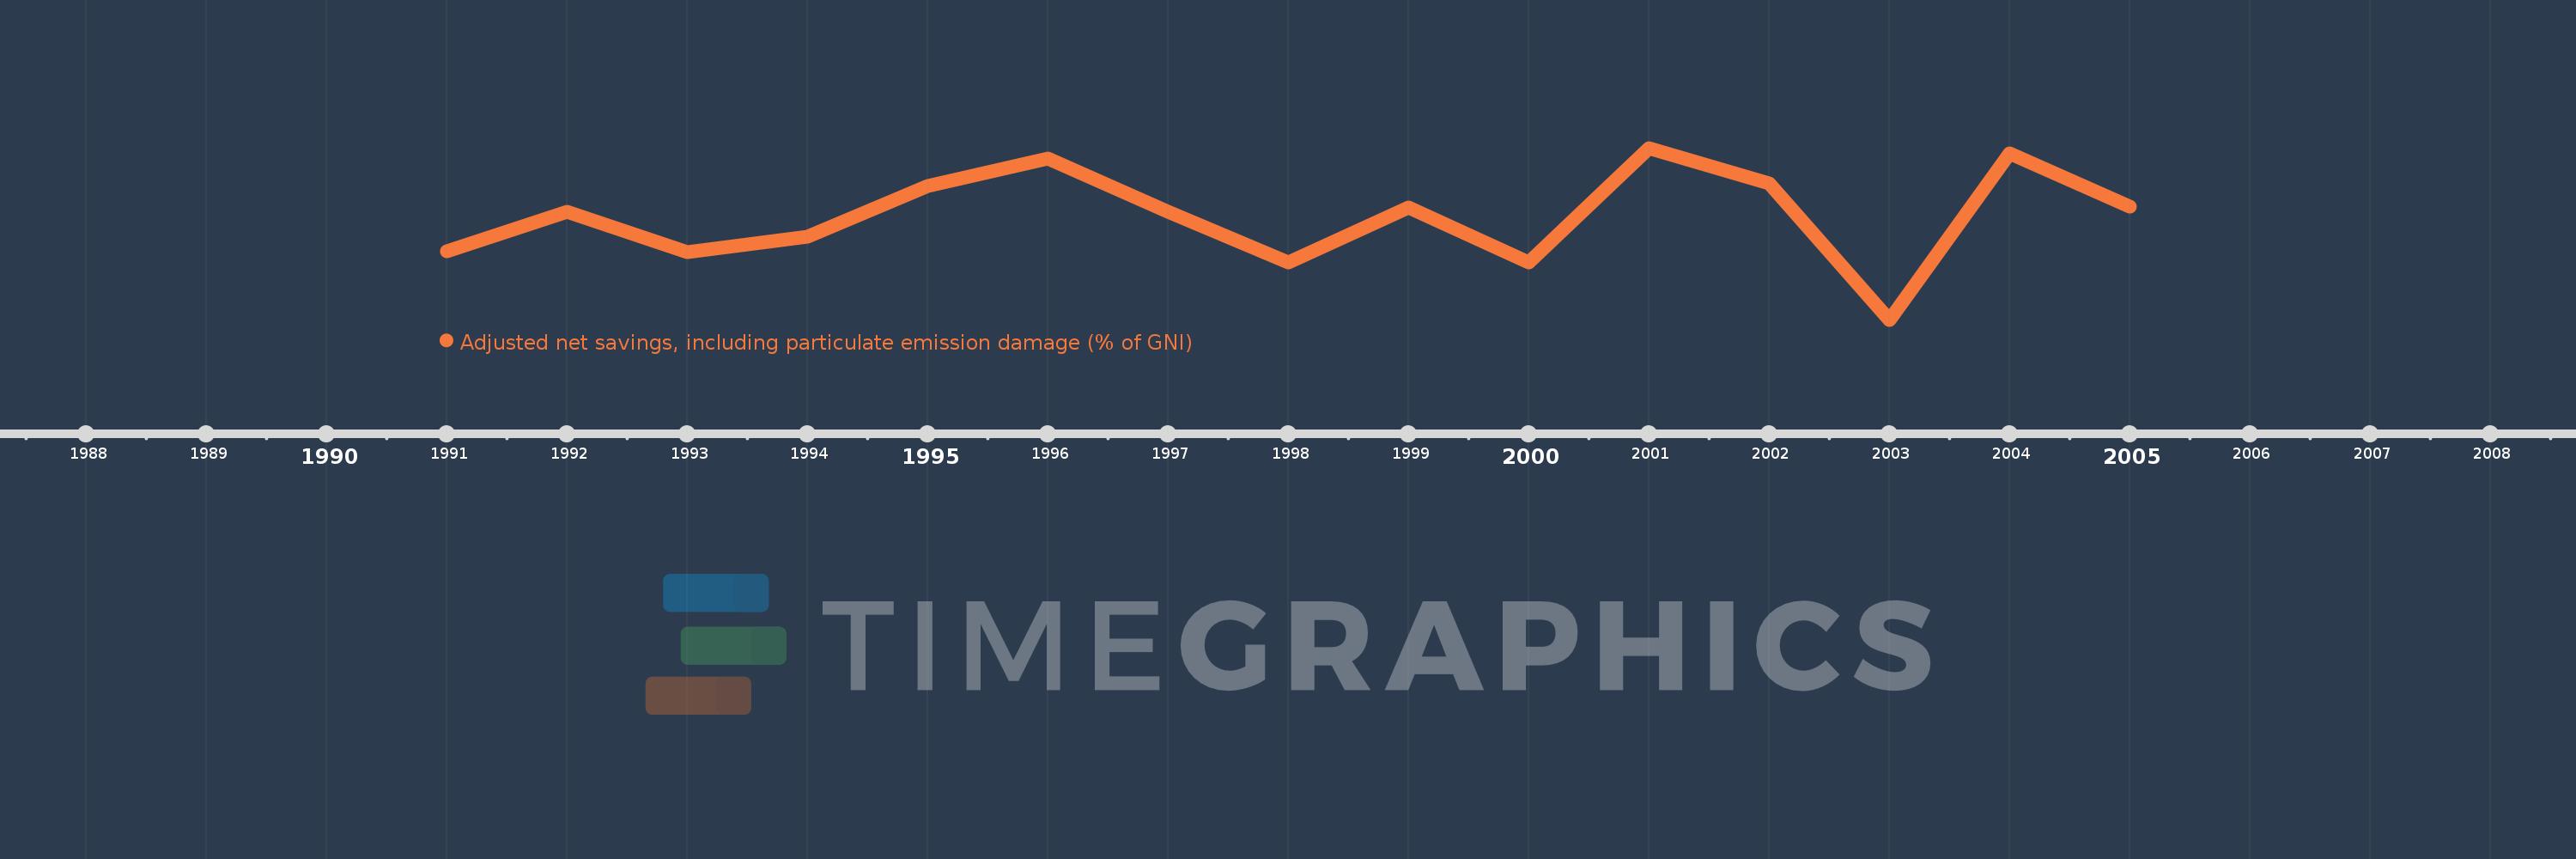
This timeline shows a graph from 1991 to 2005 of Papua New Guinea. No data until 1990. Number of actual observations by date: 15.
Source name:
World Development Indicators
Source organization:
World Bank staff estimates based on sources and methods in World Bank's "The Changing Wealth of Nations: Measuring Sustainable Development in the New Millennium" (2011).
Categories, topics:
Economy & Growth, Environment
Last updated:
apr 23, 2017
Indicators value changes by year
Meaning:
3.367
Minimum:
-6.246
jan 1, 2003
Maximum:
9.802
jan 1, 2001
At the date of observation
Value
Absolute change
Change from the previous value
jan 1, 1991
0.133
+0.133
0.0%
jan 1, 1992
3.832
+3.7
2.79K%
jan 1, 1993
0.041
-3.791
-98.93%
jan 1, 1994
1.547
+1.506
3.67K%
jan 1, 1995
6.244
+4.697
303.64%
jan 1, 1996
8.784
+2.54
40.68%
jan 1, 1997
3.812
-4.971
-56.6%
jan 1, 1998
-0.899
-4.711
-123.58%
jan 1, 1999
4.253
+5.152
-573.15%
jan 1, 2000
-0.901
-5.154
-121.18%
jan 1, 2001
9.802
+10.703
-1.19K%
jan 1, 2002
6.517
-3.285
-33.51%
jan 1, 2003
-6.246
-12.763
-195.84%
jan 1, 2004
9.303
+15.549
-248.94%
jan 1, 2005
4.285
-5.018
-53.94%
Ranking of countries by current statistics by years