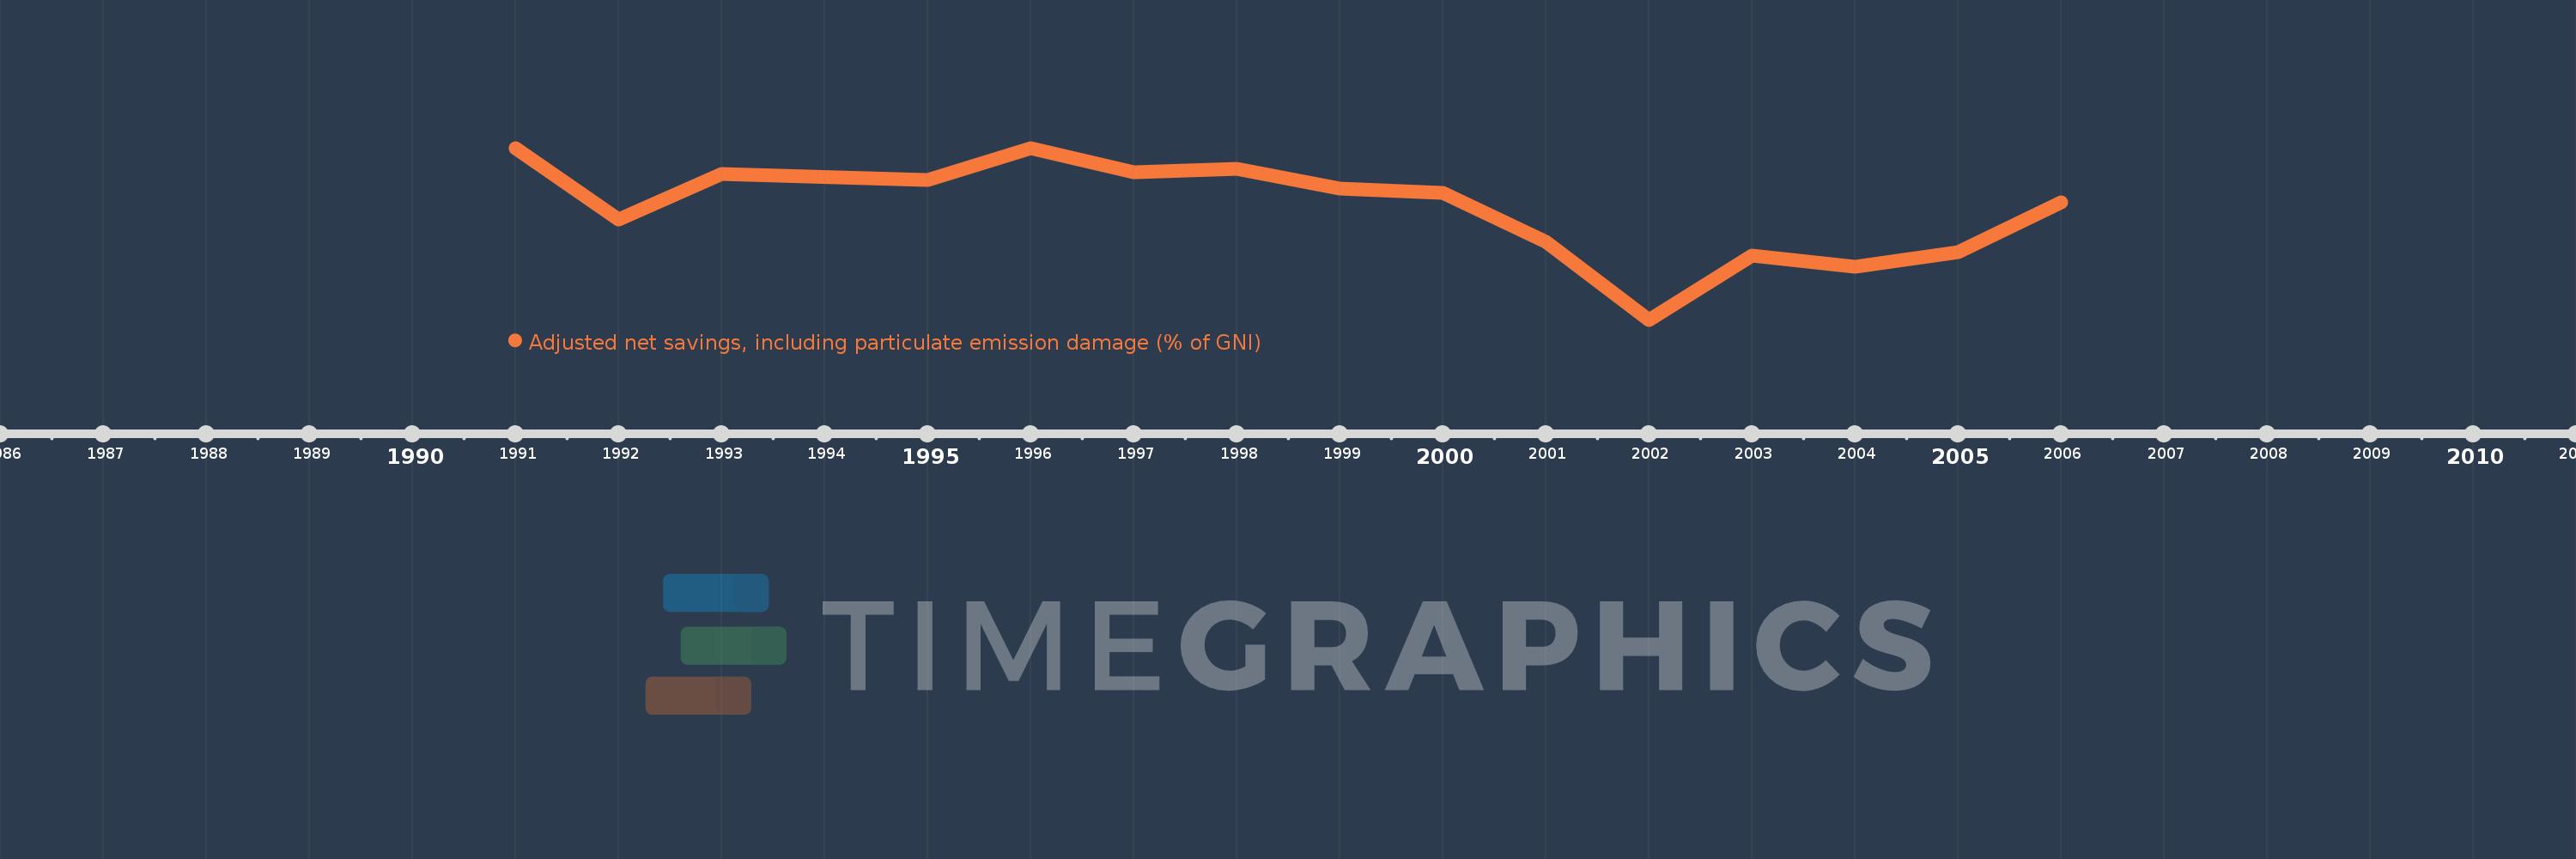
This timeline shows a graph from 1991 to 2006 of Suriname. No data until 1990. Number of actual observations by date: 15.
Source name:
World Development Indicators
Source organization:
World Bank staff estimates based on sources and methods in World Bank's "The Changing Wealth of Nations: Measuring Sustainable Development in the New Millennium" (2011).
Categories, topics:
Economy & Growth, Environment
Last updated:
apr 23, 2017
Indicators value changes by year
Meaning:
-13.519
Minimum:
-38.154
jan 1, 2002
Maximum:
-0.054
jan 1, 1991
At the date of observation
Value
Absolute change
Change from the previous value
jan 1, 1991
-0.054
-0.054
0.0%
jan 1, 1992
-15.862
-15.808
29.22K%
jan 1, 1993
-5.897
+9.965
-62.82%
jan 1, 1995
-7.15
-1.252
21.23%
jan 1, 1996
-0.146
+7.003
-97.96%
jan 1, 1997
-5.385
-5.239
3.59K%
jan 1, 1998
-4.668
+0.717
-13.31%
jan 1, 1999
-9.102
-4.434
94.99%
jan 1, 2000
-10.005
-0.902
9.91%
jan 1, 2001
-20.817
-10.813
108.07%
jan 1, 2002
-38.154
-17.337
83.28%
jan 1, 2003
-24.014
+14.14
-37.06%
jan 1, 2004
-26.33
-2.316
9.64%
jan 1, 2005
-23.088
+3.242
-12.31%
jan 1, 2006
-12.108
+10.98
-47.56%
Ranking of countries by current statistics by years