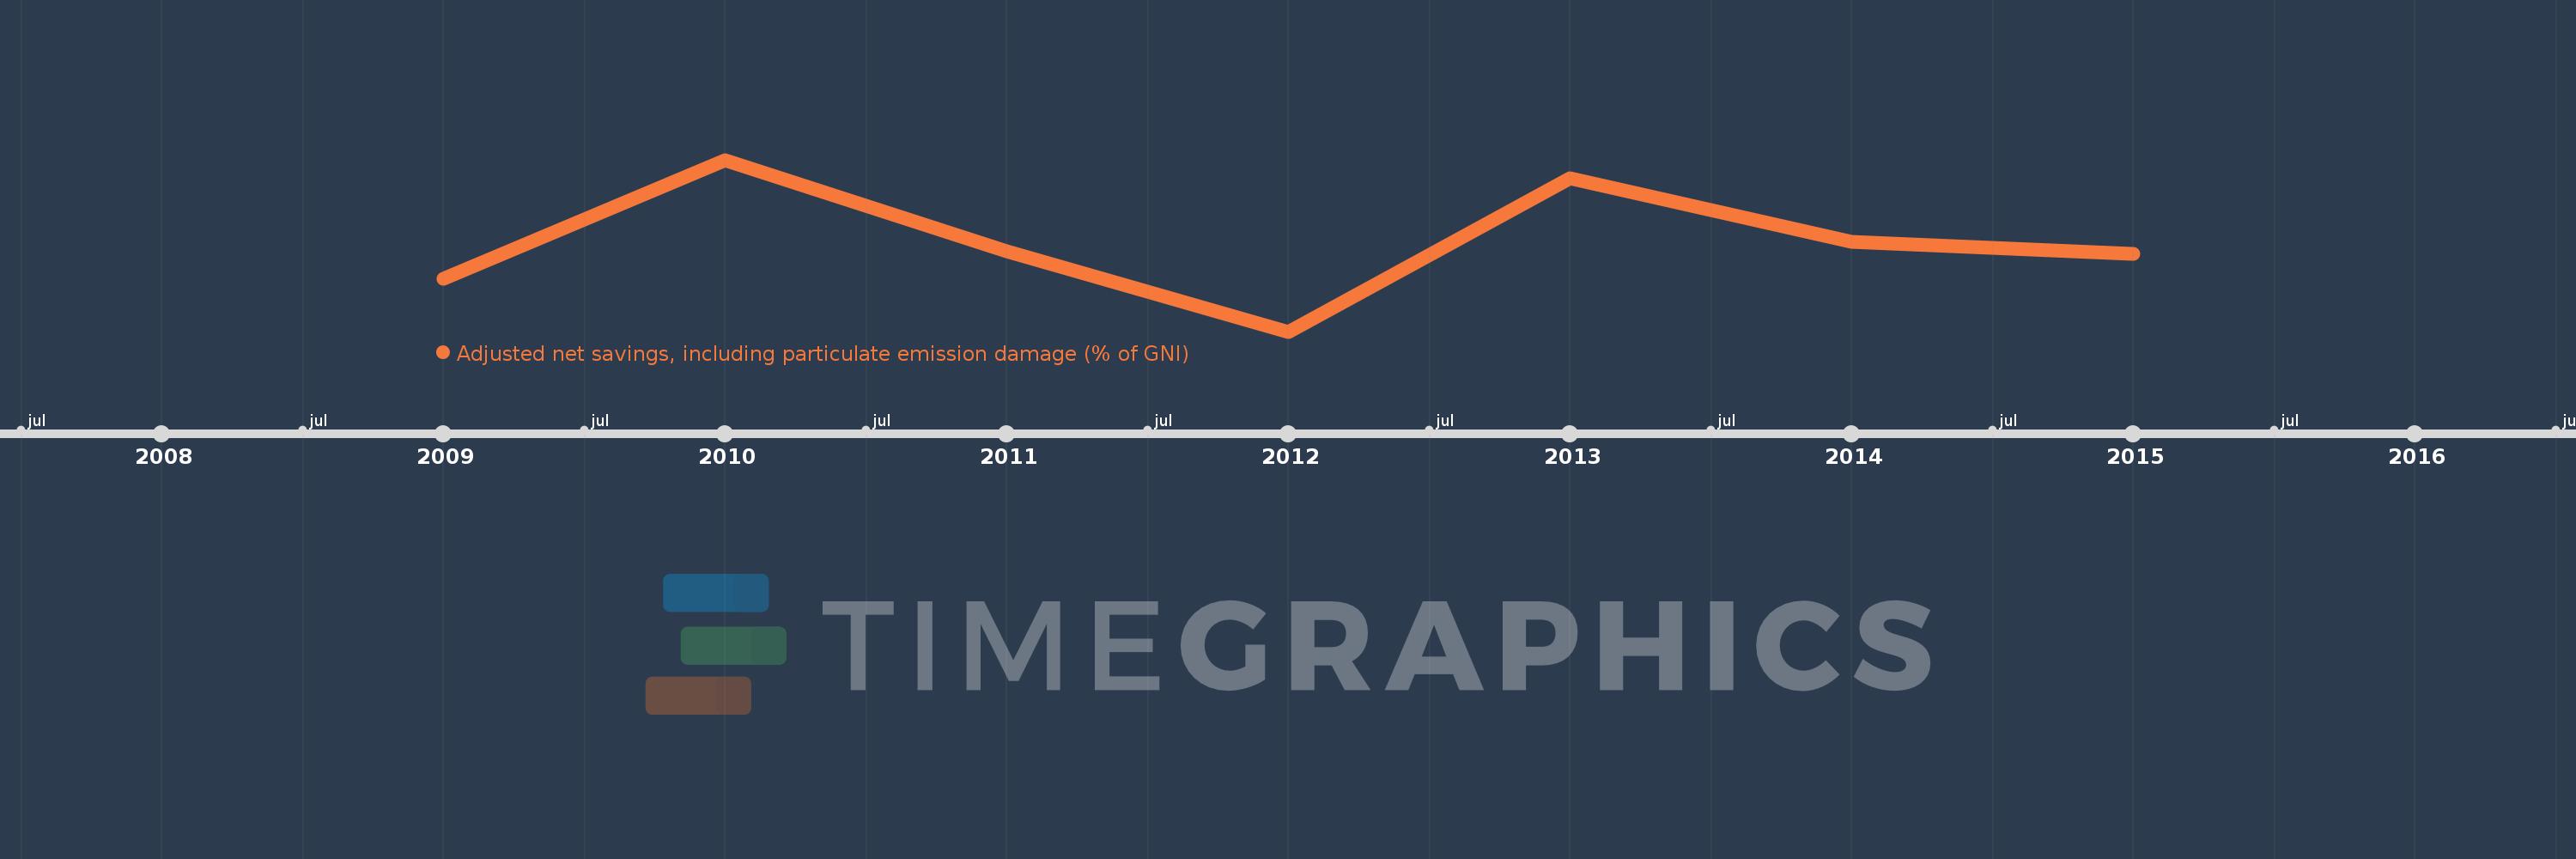
This timeline shows a graph from 2009 to 2015 of Afghanistan. No data until 2008. Number of actual observations by date: 7.
Source name:
World Development Indicators
Source organization:
World Bank staff estimates based on sources and methods in World Bank's "The Changing Wealth of Nations: Measuring Sustainable Development in the New Millennium" (2011).
Categories, topics:
Economy & Growth, Environment
Last updated:
apr 23, 2017
Indicators value changes by year
Meaning:
-17.431
Minimum:
-24.289
jan 1, 2012
Maximum:
-11.114
jan 1, 2010
At the date of observation
Value
Absolute change
Change from the previous value
jan 1, 2009
-20.205
-20.205
0.0%
jan 1, 2010
-11.114
+9.091
-44.99%
jan 1, 2011
-18.145
-7.031
63.26%
jan 1, 2012
-24.289
-6.144
33.86%
jan 1, 2013
-12.55
+11.739
-48.33%
jan 1, 2014
-17.419
-4.869
38.8%
jan 1, 2015
-18.297
-0.878
5.04%
Ranking of countries by current statistics by years