30
/
AIzaSyAYiBZKx7MnpbEhh9jyipgxe19OcubqV5w
April 1, 2024
284244
Yemen, Rep.
YEM
true
2
1
Adjusted net savings, including particulate emission damage (% of GNI)
2007,2006,2005,2004,2003,2002,2001,2000,1999,1998,1997,1996,1995,1994,1993,1992,1991
Download
Global statistics library →Yemen, Rep. →

Adjusted net savings, including particulate emission damage (% of GNI)

This statistics in other country:

AfghanistanAlbaniaAlgeriaAngolaArab WorldArgentinaArmeniaAustraliaAustriaAzerbaijanBahamas, TheBahrainBangladeshBarbadosBelarusBelgiumBelizeBeninBhutanBoliviaBotswanaBrazilBrunei DarussalamBulgariaBurkina FasoBurundiCabo VerdeCambodiaCameroonCanadaCaribbean small statesCentral African RepublicCentral Europe and the BalticsChadChileChinaColombiaComorosCongo, Dem. Rep.Congo, Rep.Costa RicaCote d'IvoireCroatiaCyprusCzech RepublicDenmarkDominican RepublicEarly-demographic dividendEast Asia & PacificEast Asia & Pacific (excluding high income)East Asia & Pacific (IDA & IBRD countries)EcuadorEgypt, Arab Rep.El SalvadorEquatorial GuineaEritreaEstoniaEthiopiaEuro areaEurope & Central AsiaEurope & Central Asia (excluding high income)Europe & Central Asia (IDA & IBRD countries)European UnionFijiFinlandFragile and conflict affected situationsFranceGabonGambia, TheGeorgiaGermanyGhanaGreeceGuatemalaGuineaGuinea-BissauGuyanaHaitiHeavily indebted poor countries (HIPC)High incomeHondurasHungaryIBRD onlyIcelandIDA & IBRD totalIDA blendIDA onlyIDA totalIndiaIndonesiaIran, Islamic Rep.IraqIrelandIsraelItalyJamaicaJapanJordanKazakhstanKenyaKorea, Rep.KuwaitKyrgyz RepublicLao PDRLate-demographic dividendLatin America & Caribbean Latin America & Caribbean (excluding high income)Latin America & the Caribbean (IDA & IBRD countries)LatviaLeast developed countries: UN classificationLebanonLesothoLiberiaLibyaLithuaniaLow & middle incomeLow incomeLower middle incomeLuxembourgMacedonia, FYRMadagascarMalawiMalaysiaMaldivesMaliMauritaniaMauritiusMexicoMiddle East & North AfricaMiddle East & North Africa (excluding high income)Middle East & North Africa (IDA & IBRD countries)Middle incomeMoldovaMongoliaMoroccoMozambiqueNamibiaNepalNetherlandsNew ZealandNicaraguaNigerNigeriaNorth AmericaNorwayOECD membersOmanOther small statesPacific island small statesPakistanPanamaPapua New GuineaParaguayPeruPhilippinesPolandPortugalPost-demographic dividendPre-demographic dividendQatarRomaniaRussian FederationRwandaSaudi ArabiaSenegalSierra LeoneSingaporeSlovak RepublicSloveniaSmall statesSolomon IslandsSouth AfricaSouth AsiaSouth Asia (IDA & IBRD)SpainSri LankaSub-Saharan Africa Sub-Saharan Africa (excluding high income)Sub-Saharan Africa (IDA & IBRD countries)SudanSurinameSwazilandSwedenSwitzerlandSyrian Arab RepublicTajikistanTanzaniaThailandTogoTrinidad and TobagoTunisiaTurkeyUgandaUkraineUnited KingdomUnited StatesUpper middle incomeUruguayVenezuela, RBVietnamWorldYemen, Rep.ZambiaZimbabwe

Timeline:

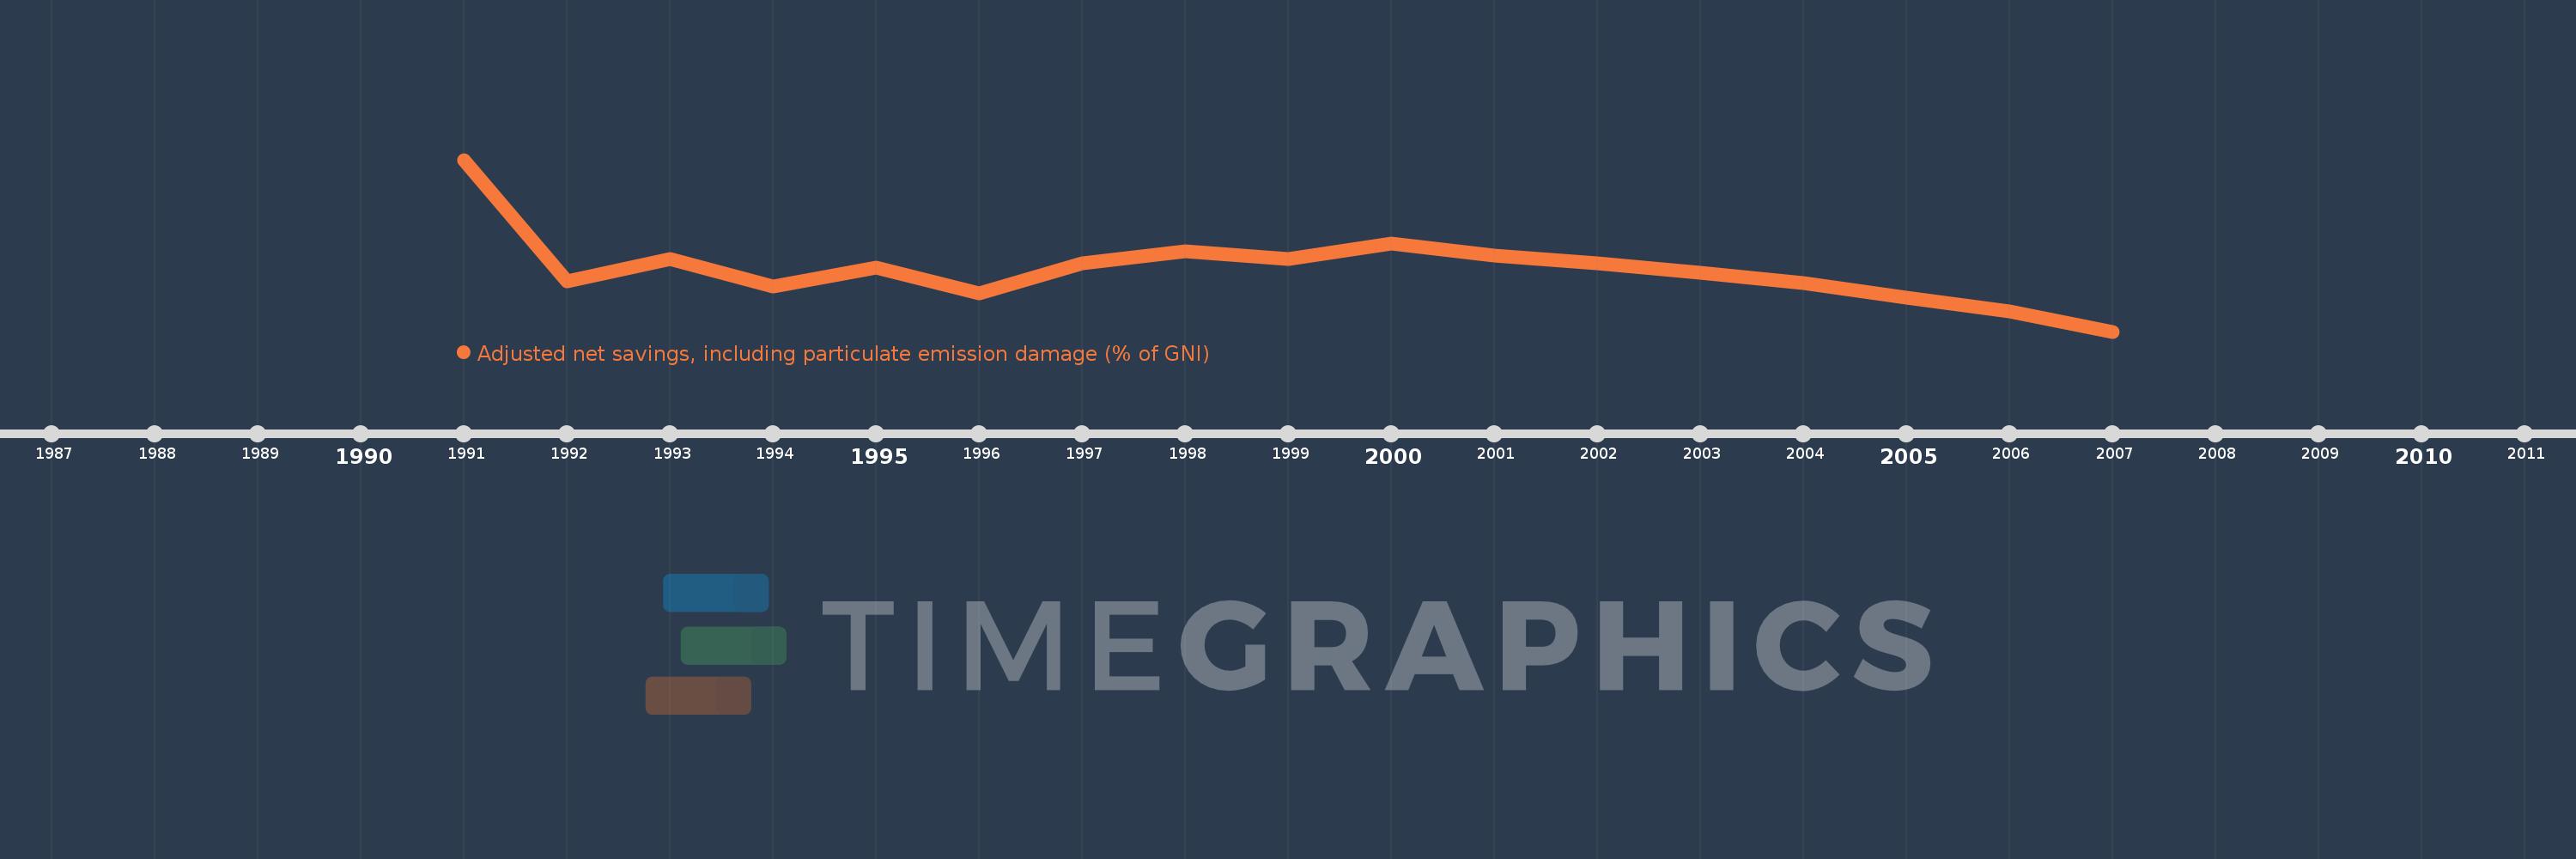
This timeline shows a graph from 1991 to 2007 of Yemen, Rep.. No data until 1990. Number of actual observations by date: 17.

Source name:

World Development Indicators

Source organization:

World Bank staff estimates based on sources and methods in World Bank's "The Changing Wealth of Nations: Measuring Sustainable Development in the New Millennium" (2011).

Categories, topics:

Economy & Growth, Environment

Last updated:

apr 23, 2017

Indicators value changes by year

Meaning:
1.247
Minimum:
-11.537
jan 1, 2007
Maximum:
23.813
jan 1, 1991
At the date of observation
Value
Absolute change
Change from the previous value
jan 1, 1991
23.813
+23.813
0.0%
jan 1, 1992
-1.186
-24.999
-104.98%
jan 1, 1993
3.399
+4.585
-386.55%
jan 1, 1994
-2.285
-5.684
-167.22%
jan 1, 1995
1.653
+3.938
-172.35%
jan 1, 1996
-3.705
-5.358
-324.1%
jan 1, 1997
2.449
+6.154
-166.11%
jan 1, 1998
4.982
+2.532
103.4%
jan 1, 1999
3.401
-1.58
-31.72%
jan 1, 2000
6.512
+3.111
91.46%
jan 1, 2001
4.188
-2.324
-35.69%
jan 1, 2002
2.547
-1.641
-39.19%
jan 1, 2003
0.542
-2.005
-78.73%
jan 1, 2004
-1.488
-2.029
-374.57%
jan 1, 2005
-4.623
-3.135
210.74%
jan 1, 2006
-7.458
-2.836
61.35%
jan 1, 2007
-11.537
-4.079
54.69%

Ranking of countries by current statistics by years