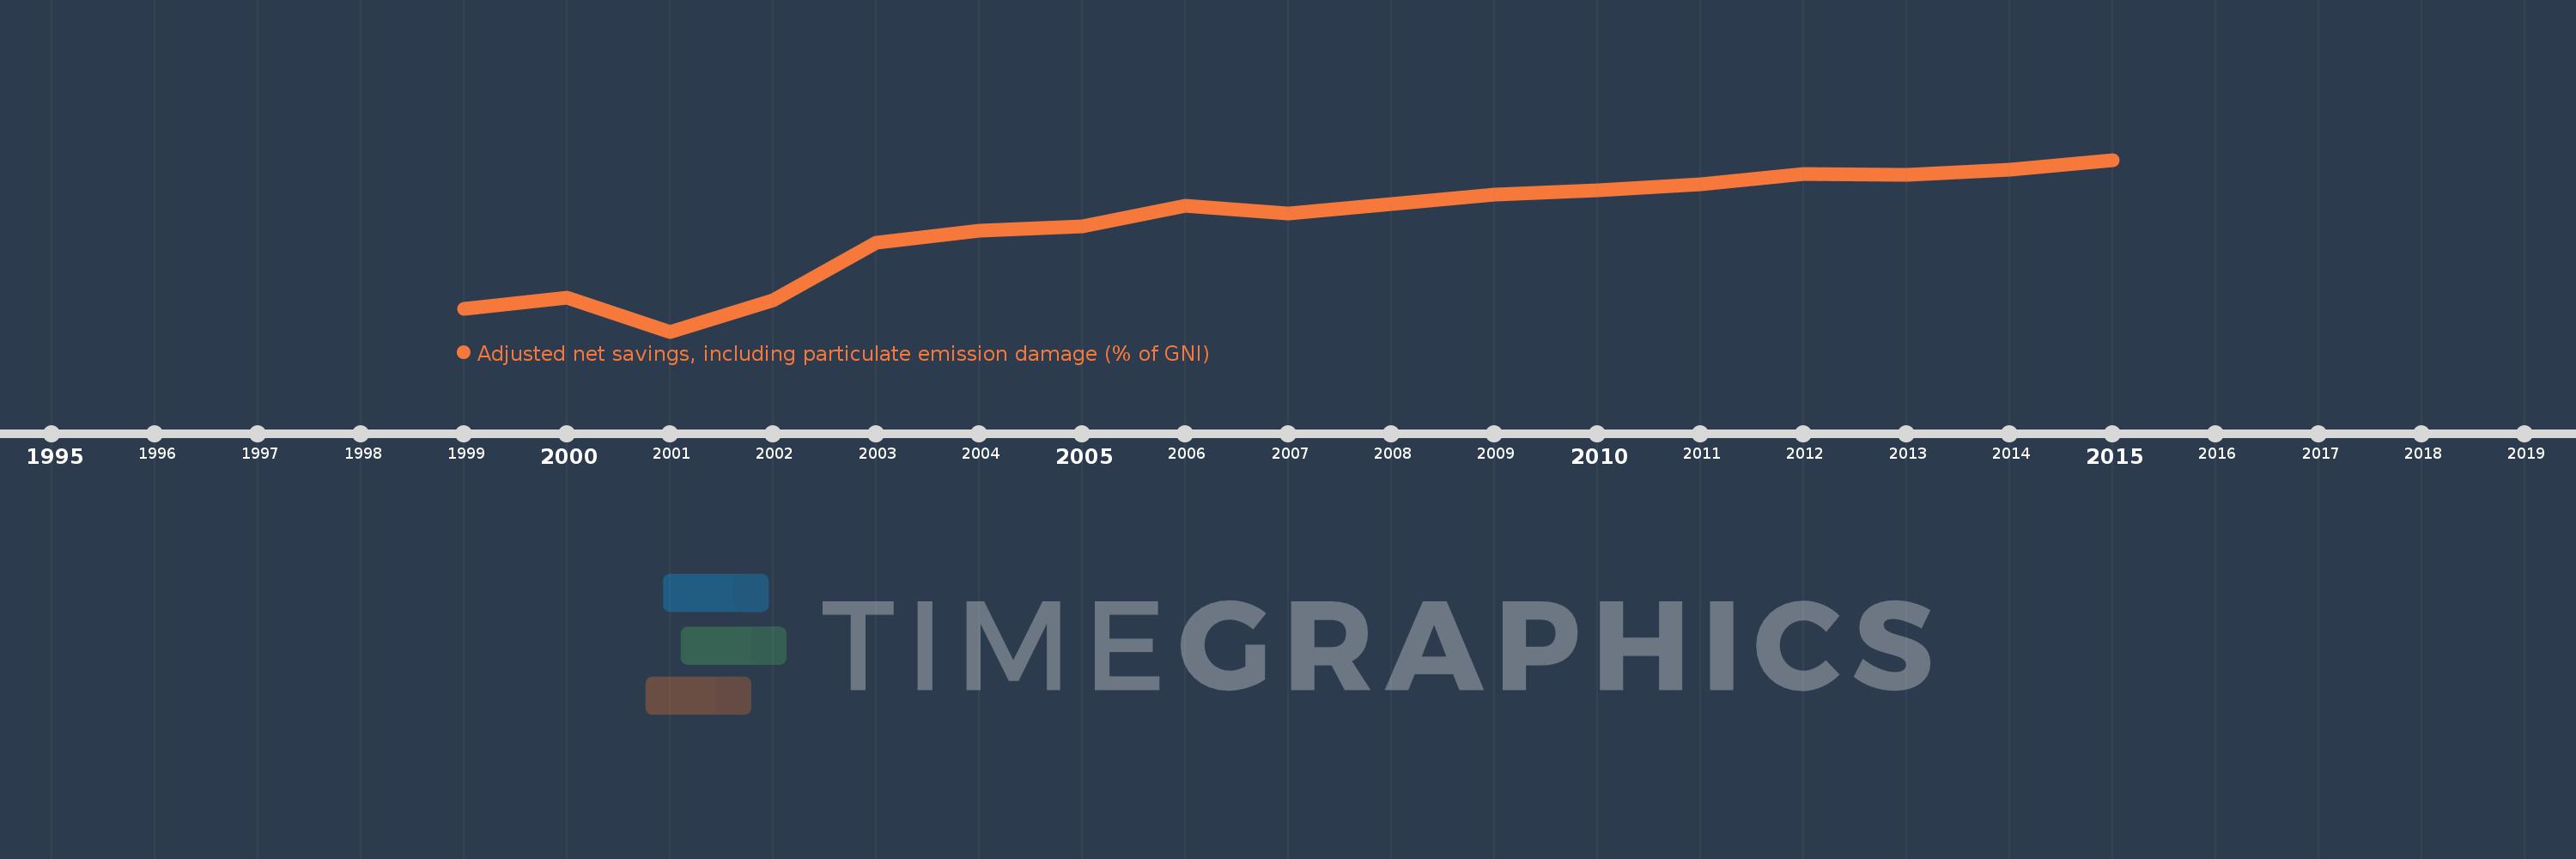
This timeline shows a graph from 1999 to 2015 of Azerbaijan. No data until 1998. Number of actual observations by date: 17.
Source name:
World Development Indicators
Source organization:
World Bank staff estimates based on sources and methods in World Bank's "The Changing Wealth of Nations: Measuring Sustainable Development in the New Millennium" (2011).
Categories, topics:
Economy & Growth, Environment
Last updated:
apr 23, 2017
Indicators value changes by year
Meaning:
-3.466
Minimum:
-39.104
jan 1, 2001
Maximum:
17.829
jan 1, 2015
At the date of observation
Value
Absolute change
Change from the previous value
jan 1, 1999
-31.514
-31.514
0.0%
jan 1, 2000
-27.913
+3.601
-11.43%
jan 1, 2001
-39.104
-11.191
40.09%
jan 1, 2002
-28.607
+10.497
-26.84%
jan 1, 2003
-9.656
+18.951
-66.24%
jan 1, 2004
-5.696
+3.96
-41.01%
jan 1, 2005
-4.17
+1.526
-26.8%
jan 1, 2006
2.514
+6.684
-160.3%
jan 1, 2007
-0.05
-2.565
-102.0%
jan 1, 2008
3.117
+3.167
-6.29K%
jan 1, 2009
6.381
+3.264
104.72%
jan 1, 2010
7.71
+1.33
20.84%
jan 1, 2011
9.843
+2.133
27.66%
jan 1, 2012
13.106
+3.262
33.14%
jan 1, 2013
12.741
-0.364
-2.78%
jan 1, 2014
14.539
+1.798
14.11%
jan 1, 2015
17.829
+3.29
22.63%
Ranking of countries by current statistics by years