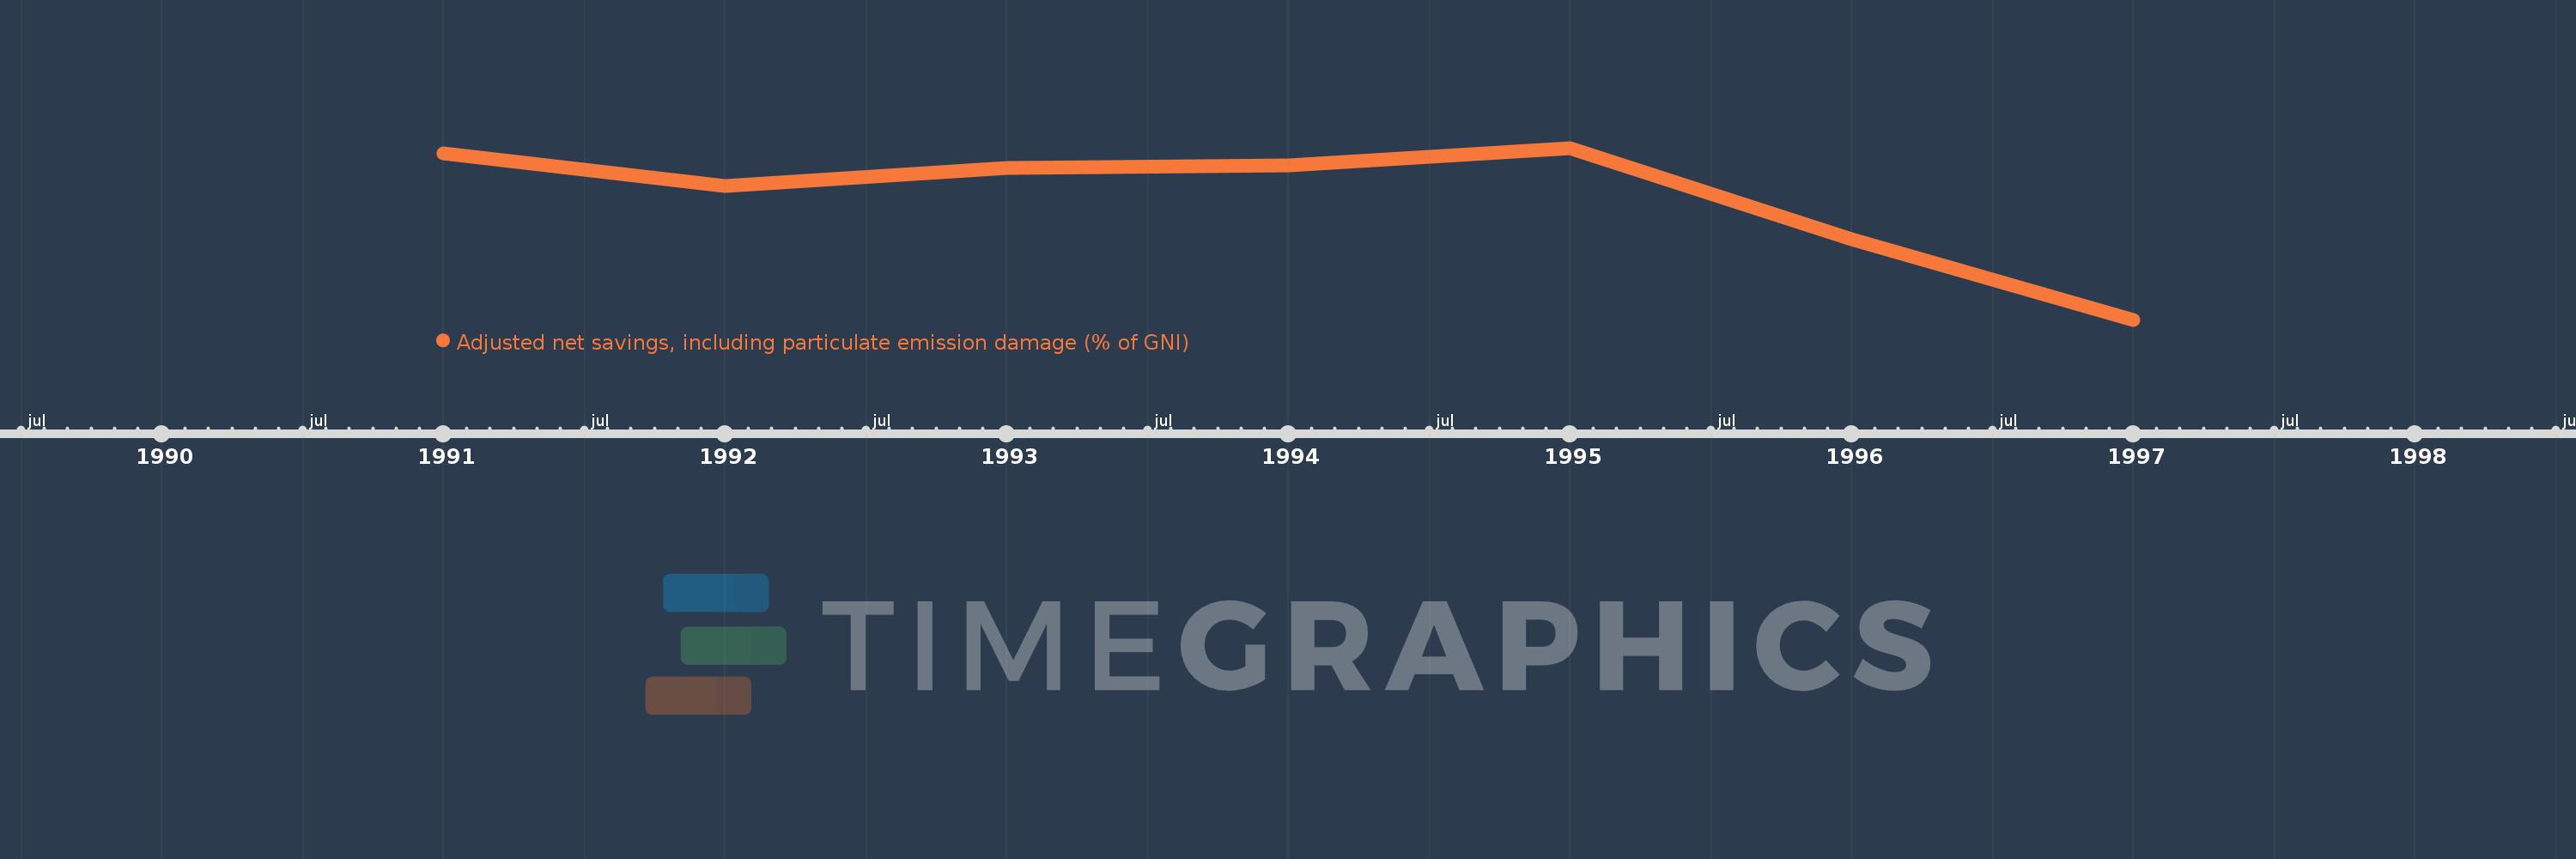
This timeline shows a graph from 1991 to 1997 of Equatorial Guinea. No data until 1990. Number of actual observations by date: 7.
Source name:
World Development Indicators
Source organization:
World Bank staff estimates based on sources and methods in World Bank's "The Changing Wealth of Nations: Measuring Sustainable Development in the New Millennium" (2011).
Categories, topics:
Economy & Growth, Environment
Last updated:
apr 23, 2017
Indicators value changes by year
Meaning:
-41.276
Minimum:
-238.29
jan 1, 1997
Maximum:
37.846
jan 1, 1995
At the date of observation
Value
Absolute change
Change from the previous value
jan 1, 1991
29.681
+29.681
0.0%
jan 1, 1992
-23.842
-53.523
-180.33%
jan 1, 1993
5.698
+29.54
-123.9%
jan 1, 1994
9.444
+3.746
65.74%
jan 1, 1995
37.846
+28.402
300.73%
jan 1, 1996
-109.47
-147.316
-389.25%
jan 1, 1997
-238.29
-128.821
117.68%
Ranking of countries by current statistics by years