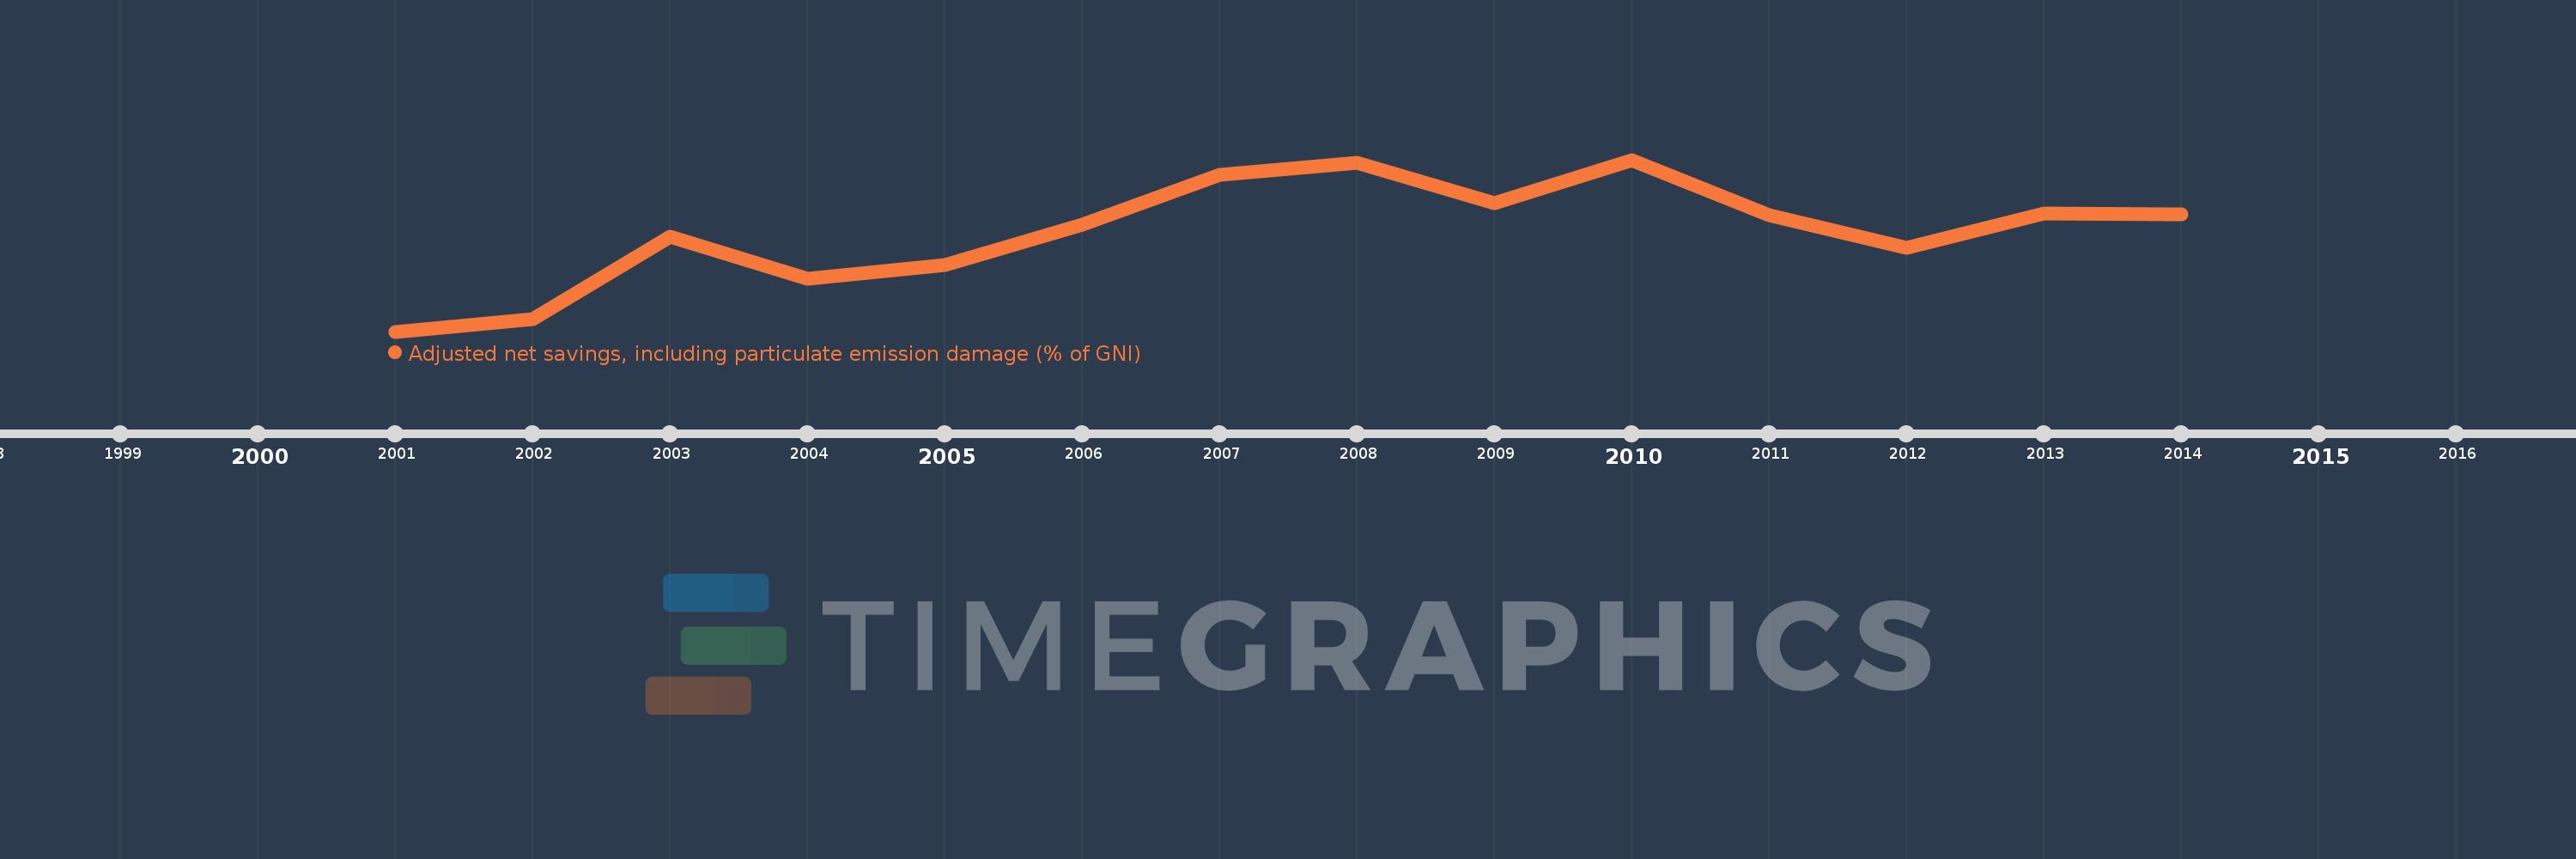
This timeline shows a graph from 2001 to 2014 of Lao PDR. No data until 2000. Number of actual observations by date: 14.
Source name:
World Development Indicators
Source organization:
World Bank staff estimates based on sources and methods in World Bank's "The Changing Wealth of Nations: Measuring Sustainable Development in the New Millennium" (2011).
Categories, topics:
Economy & Growth, Environment
Last updated:
apr 23, 2017
Indicators value changes by year
Meaning:
-5.907
Minimum:
-15.913
jan 1, 2001
Maximum:
1.35
jan 1, 2010
At the date of observation
Value
Absolute change
Change from the previous value
jan 1, 2001
-15.913
-15.913
0.0%
jan 1, 2002
-14.693
+1.219
-7.66%
jan 1, 2003
-6.384
+8.309
-56.55%
jan 1, 2004
-10.573
-4.189
65.62%
jan 1, 2005
-9.243
+1.33
-12.58%
jan 1, 2006
-5.209
+4.033
-43.64%
jan 1, 2007
-0.173
+5.037
-96.69%
jan 1, 2008
1.081
+1.254
-726.92%
jan 1, 2009
-2.99
-4.072
-376.48%
jan 1, 2010
1.35
+4.34
-145.13%
jan 1, 2011
-4.253
-5.603
-415.16%
jan 1, 2012
-7.485
-3.232
75.99%
jan 1, 2013
-4.087
+3.398
-45.4%
jan 1, 2014
-4.128
-0.041
1.01%
Ranking of countries by current statistics by years