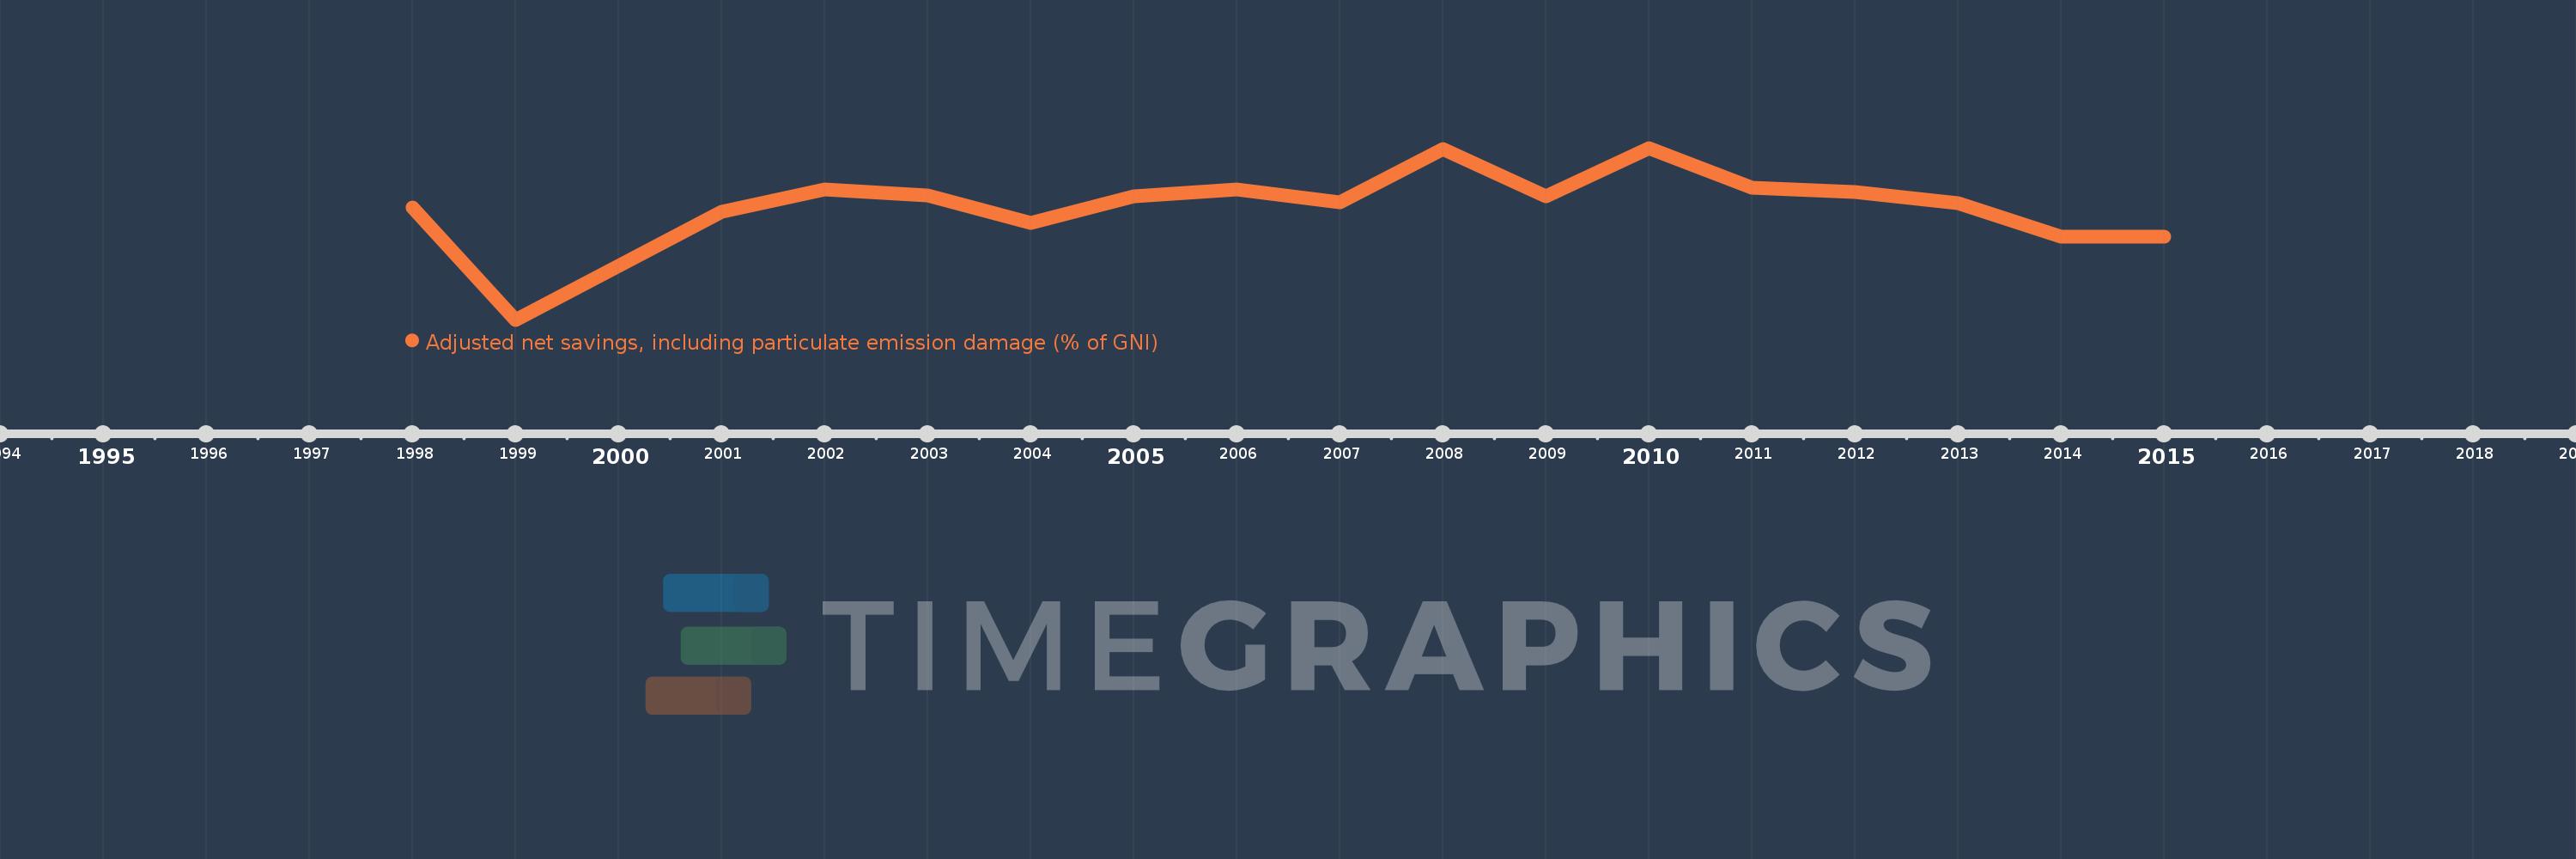
This timeline shows a graph from 1998 to 2015 of Kyrgyz Republic. No data until 1997. Number of actual observations by date: 18.
Source name:
World Development Indicators
Source organization:
World Bank staff estimates based on sources and methods in World Bank's "The Changing Wealth of Nations: Measuring Sustainable Development in the New Millennium" (2011).
Categories, topics:
Economy & Growth, Environment
Last updated:
apr 23, 2017
Indicators value changes by year
Meaning:
0.379
Minimum:
-23.998
jan 1, 1999
Maximum:
13.619
jan 1, 2010
At the date of observation
Value
Absolute change
Change from the previous value
jan 1, 1998
0.528
+0.528
0.0%
jan 1, 1999
-23.998
-24.527
-4.64K%
jan 1, 2000
-12.123
+11.876
-49.49%
jan 1, 2001
-0.356
+11.766
-97.06%
jan 1, 2002
4.53
+4.887
-1.37K%
jan 1, 2003
3.277
-1.254
-27.67%
jan 1, 2004
-2.886
-6.163
-188.09%
jan 1, 2005
2.989
+5.875
-203.56%
jan 1, 2006
4.518
+1.529
51.14%
jan 1, 2007
1.689
-2.828
-62.61%
jan 1, 2008
13.364
+11.675
691.13%
jan 1, 2009
3.023
-10.341
-77.38%
jan 1, 2010
13.619
+10.597
350.58%
jan 1, 2011
4.853
-8.766
-64.36%
jan 1, 2012
4.064
-0.79
-16.27%
jan 1, 2013
1.447
-2.617
-64.4%
jan 1, 2014
-5.887
-7.333
-506.97%
jan 1, 2015
-5.83
+0.057
-0.97%
Ranking of countries by current statistics by years