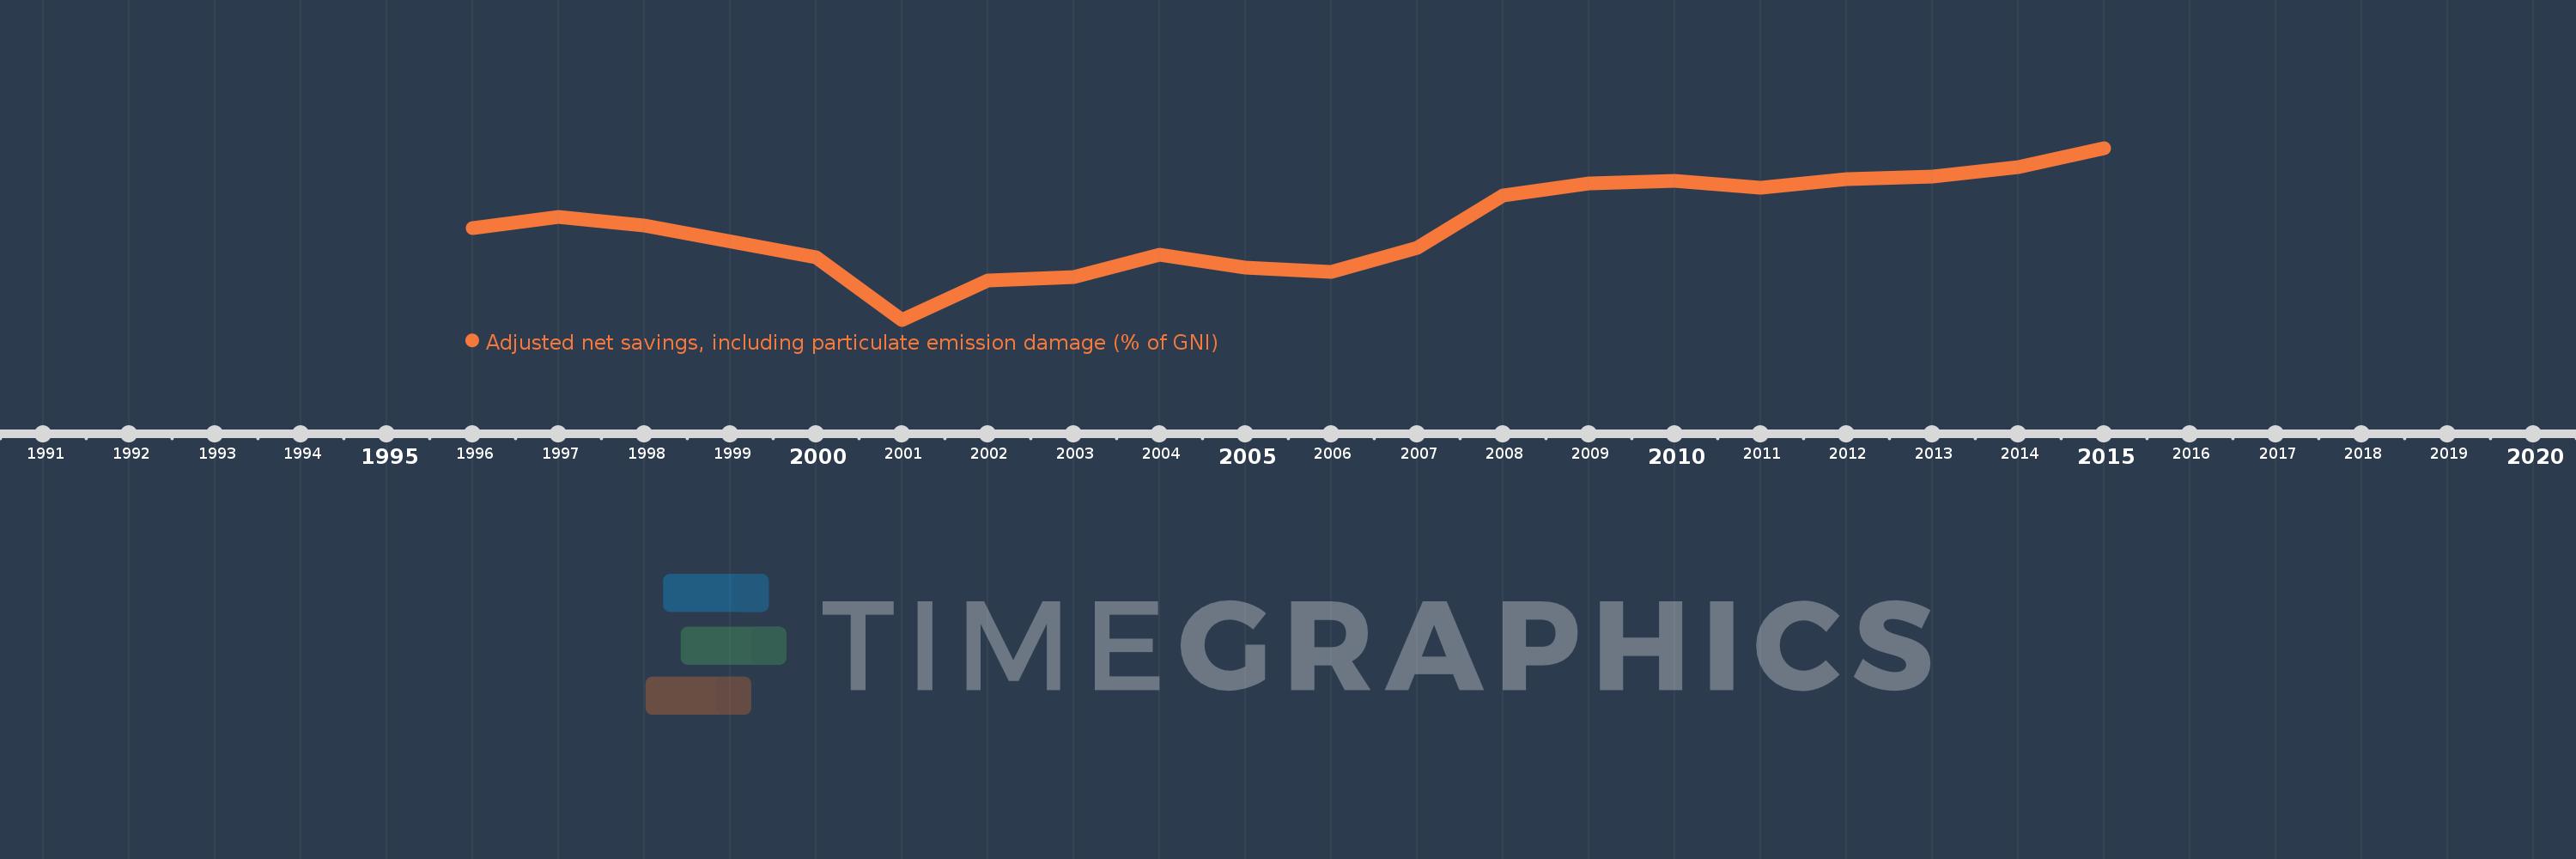
This timeline shows a graph from 1996 to 2015 of Kazakhstan. No data until 1995. Number of actual observations by date: 19.
Source name:
World Development Indicators
Source organization:
World Bank staff estimates based on sources and methods in World Bank's "The Changing Wealth of Nations: Measuring Sustainable Development in the New Millennium" (2011).
Categories, topics:
Economy & Growth, Environment
Last updated:
apr 23, 2017
Indicators value changes by year
Meaning:
-11.376
Minimum:
-29.239
jan 1, 2001
Maximum:
2.993
jan 1, 2015
At the date of observation
Value
Absolute change
Change from the previous value
jan 1, 1996
-12.014
-12.014
0.0%
jan 1, 1997
-10.005
+2.01
-16.73%
jan 1, 1998
-11.628
-1.623
16.23%
jan 1, 2000
-17.536
-5.908
50.81%
jan 1, 2001
-29.239
-11.704
66.74%
jan 1, 2002
-21.809
+7.431
-25.41%
jan 1, 2003
-21.175
+0.633
-2.9%
jan 1, 2004
-17.05
+4.125
-19.48%
jan 1, 2005
-19.519
-2.468
14.48%
jan 1, 2006
-20.214
-0.695
3.56%
jan 1, 2007
-15.769
+4.445
-21.99%
jan 1, 2008
-5.862
+9.907
-62.83%
jan 1, 2009
-3.723
+2.139
-36.49%
jan 1, 2010
-3.2
+0.523
-14.05%
jan 1, 2011
-4.5
-1.3
40.64%
jan 1, 2012
-2.868
+1.632
-36.27%
jan 1, 2013
-2.354
+0.514
-17.91%
jan 1, 2014
-0.673
+1.681
-71.43%
jan 1, 2015
2.993
+3.665
-544.97%
Ranking of countries by current statistics by years