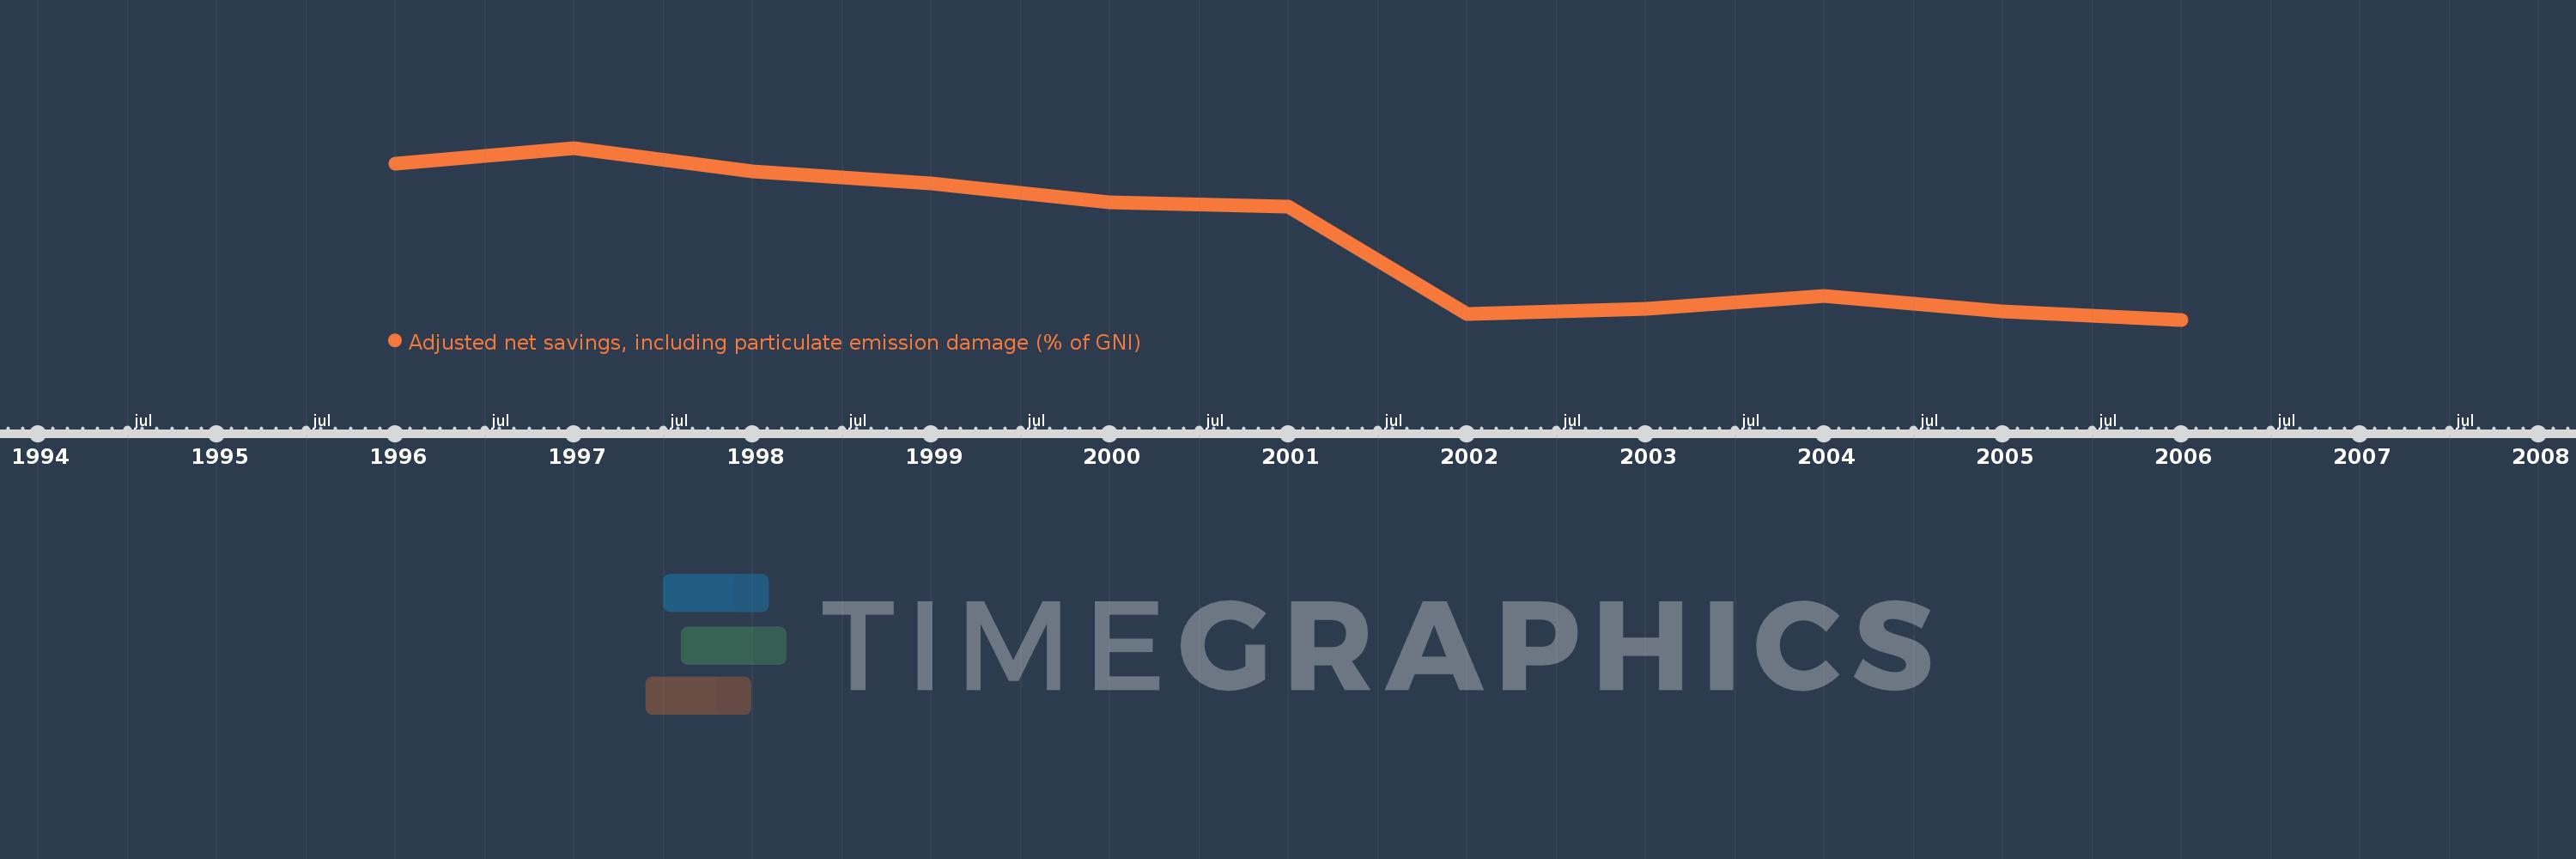
This timeline shows a graph from 1996 to 2006 of Maldives. No data until 1995. Number of actual observations by date: 11.
Source name:
World Development Indicators
Source organization:
World Bank staff estimates based on sources and methods in World Bank's "The Changing Wealth of Nations: Measuring Sustainable Development in the New Millennium" (2011).
Categories, topics:
Economy & Growth, Environment
Last updated:
apr 23, 2017
Indicators value changes by year
Meaning:
26.017
Minimum:
8.559
jan 1, 2006
Maximum:
45.599
jan 1, 1997
At the date of observation
Value
Absolute change
Change from the previous value
jan 1, 1996
42.12
+42.12
0.0%
jan 1, 1997
45.599
+3.48
8.26%
jan 1, 1998
40.609
-4.99
-10.94%
jan 1, 1999
37.88
-2.729
-6.72%
jan 1, 2000
33.804
-4.076
-10.76%
jan 1, 2001
32.944
-0.86
-2.54%
jan 1, 2002
9.807
-23.138
-70.23%
jan 1, 2003
10.883
+1.076
10.97%
jan 1, 2004
13.657
+2.774
25.49%
jan 1, 2005
10.325
-3.332
-24.4%
jan 1, 2006
8.559
-1.766
-17.11%
Ranking of countries by current statistics by years