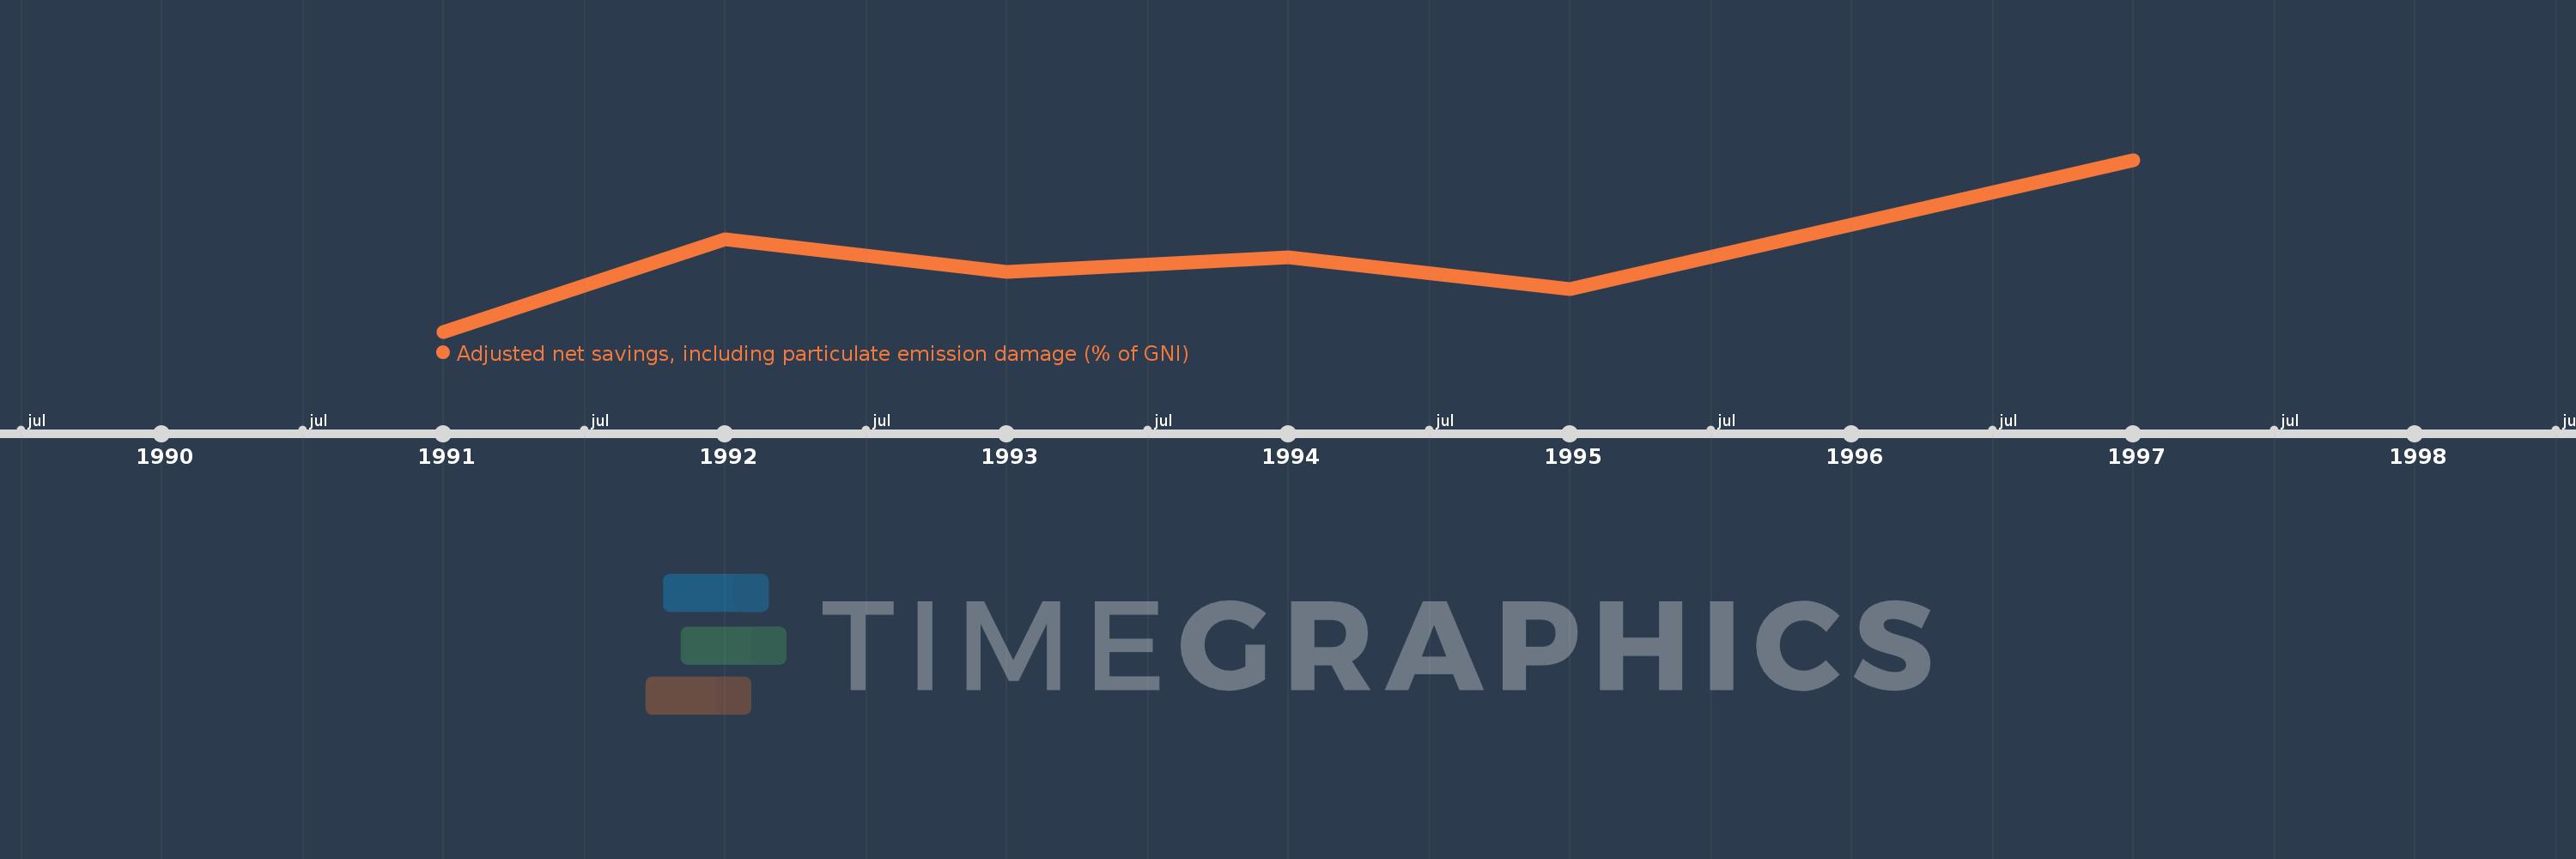
This timeline shows a graph from 1991 to 1997 of Pacific island small states. No data until 1990. Number of actual observations by date: 6.
Source name:
World Development Indicators
Source organization:
World Bank staff estimates based on sources and methods in World Bank's "The Changing Wealth of Nations: Measuring Sustainable Development in the New Millennium" (2011).
Categories, topics:
Economy & Growth, Environment
Last updated:
apr 23, 2017
Indicators value changes by year
Meaning:
1.571
Minimum:
-4.931
jan 1, 1991
Maximum:
10.266
jan 1, 1997
At the date of observation
Value
Absolute change
Change from the previous value
jan 1, 1991
-4.931
-4.931
0.0%
jan 1, 1992
3.249
+8.18
-165.89%
jan 1, 1993
0.375
-2.874
-88.46%
jan 1, 1994
1.61
+1.236
329.52%
jan 1, 1995
-1.144
-2.755
-171.06%
jan 1, 1997
10.266
+11.41
-997.11%
Ranking of countries by current statistics by years