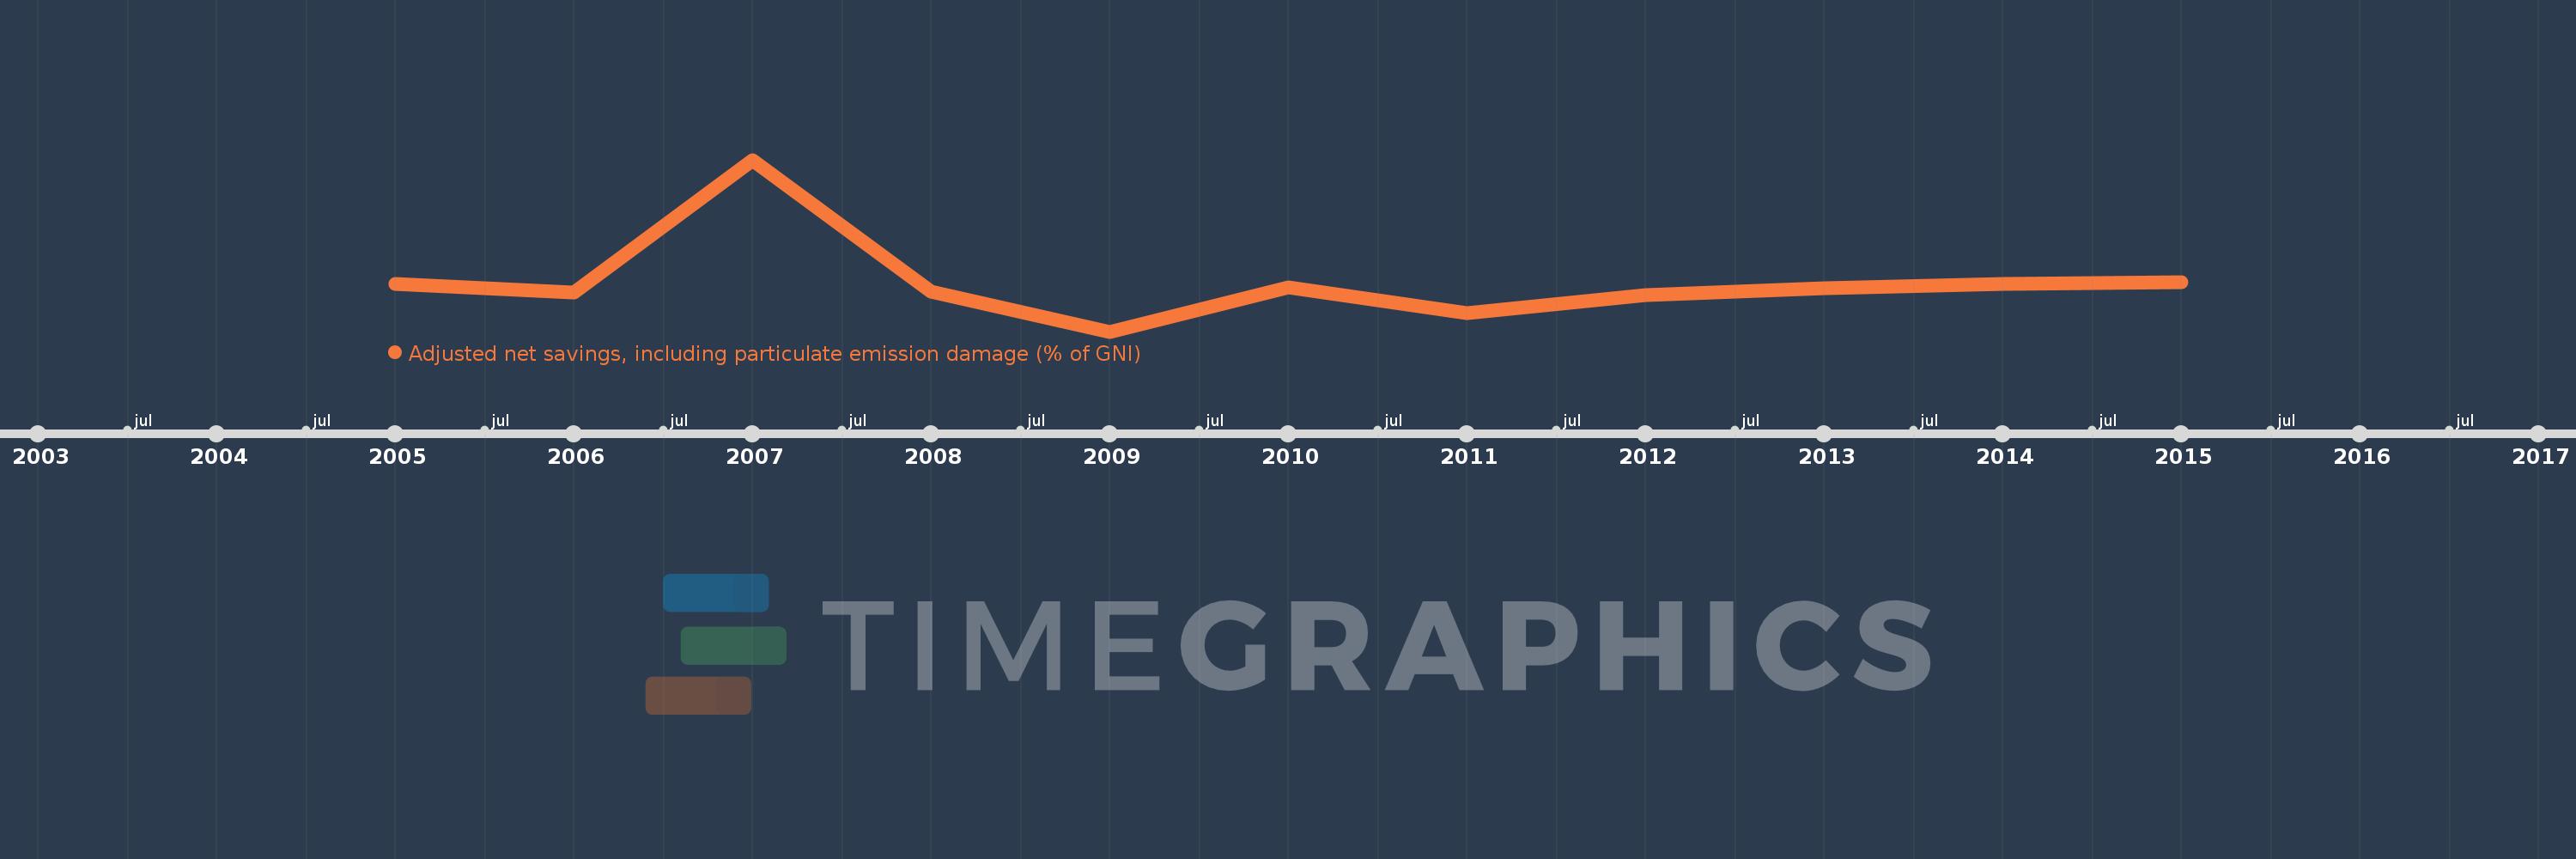
This timeline shows a graph from 2005 to 2015 of Liberia. No data until 2004. Number of actual observations by date: 11.
Source name:
World Development Indicators
Source organization:
World Bank staff estimates based on sources and methods in World Bank's "The Changing Wealth of Nations: Measuring Sustainable Development in the New Millennium" (2011).
Categories, topics:
Economy & Growth, Environment
Last updated:
apr 23, 2017
Indicators value changes by year
Meaning:
-28.249
Minimum:
-75.642
jan 1, 2009
Maximum:
90.549
jan 1, 2007
At the date of observation
Value
Absolute change
Change from the previous value
jan 1, 2005
-29.543
-29.543
0.0%
jan 1, 2006
-37.797
-8.253
27.94%
jan 1, 2007
90.549
+128.346
-339.57%
jan 1, 2008
-36.652
-127.201
-140.48%
jan 1, 2009
-75.642
-38.991
106.38%
jan 1, 2010
-32.517
+43.125
-57.01%
jan 1, 2011
-57.965
-25.448
78.26%
jan 1, 2012
-40.465
+17.499
-30.19%
jan 1, 2013
-33.285
+7.18
-17.74%
jan 1, 2014
-29.549
+3.736
-11.23%
jan 1, 2015
-27.874
+1.675
-5.67%
Ranking of countries by current statistics by years