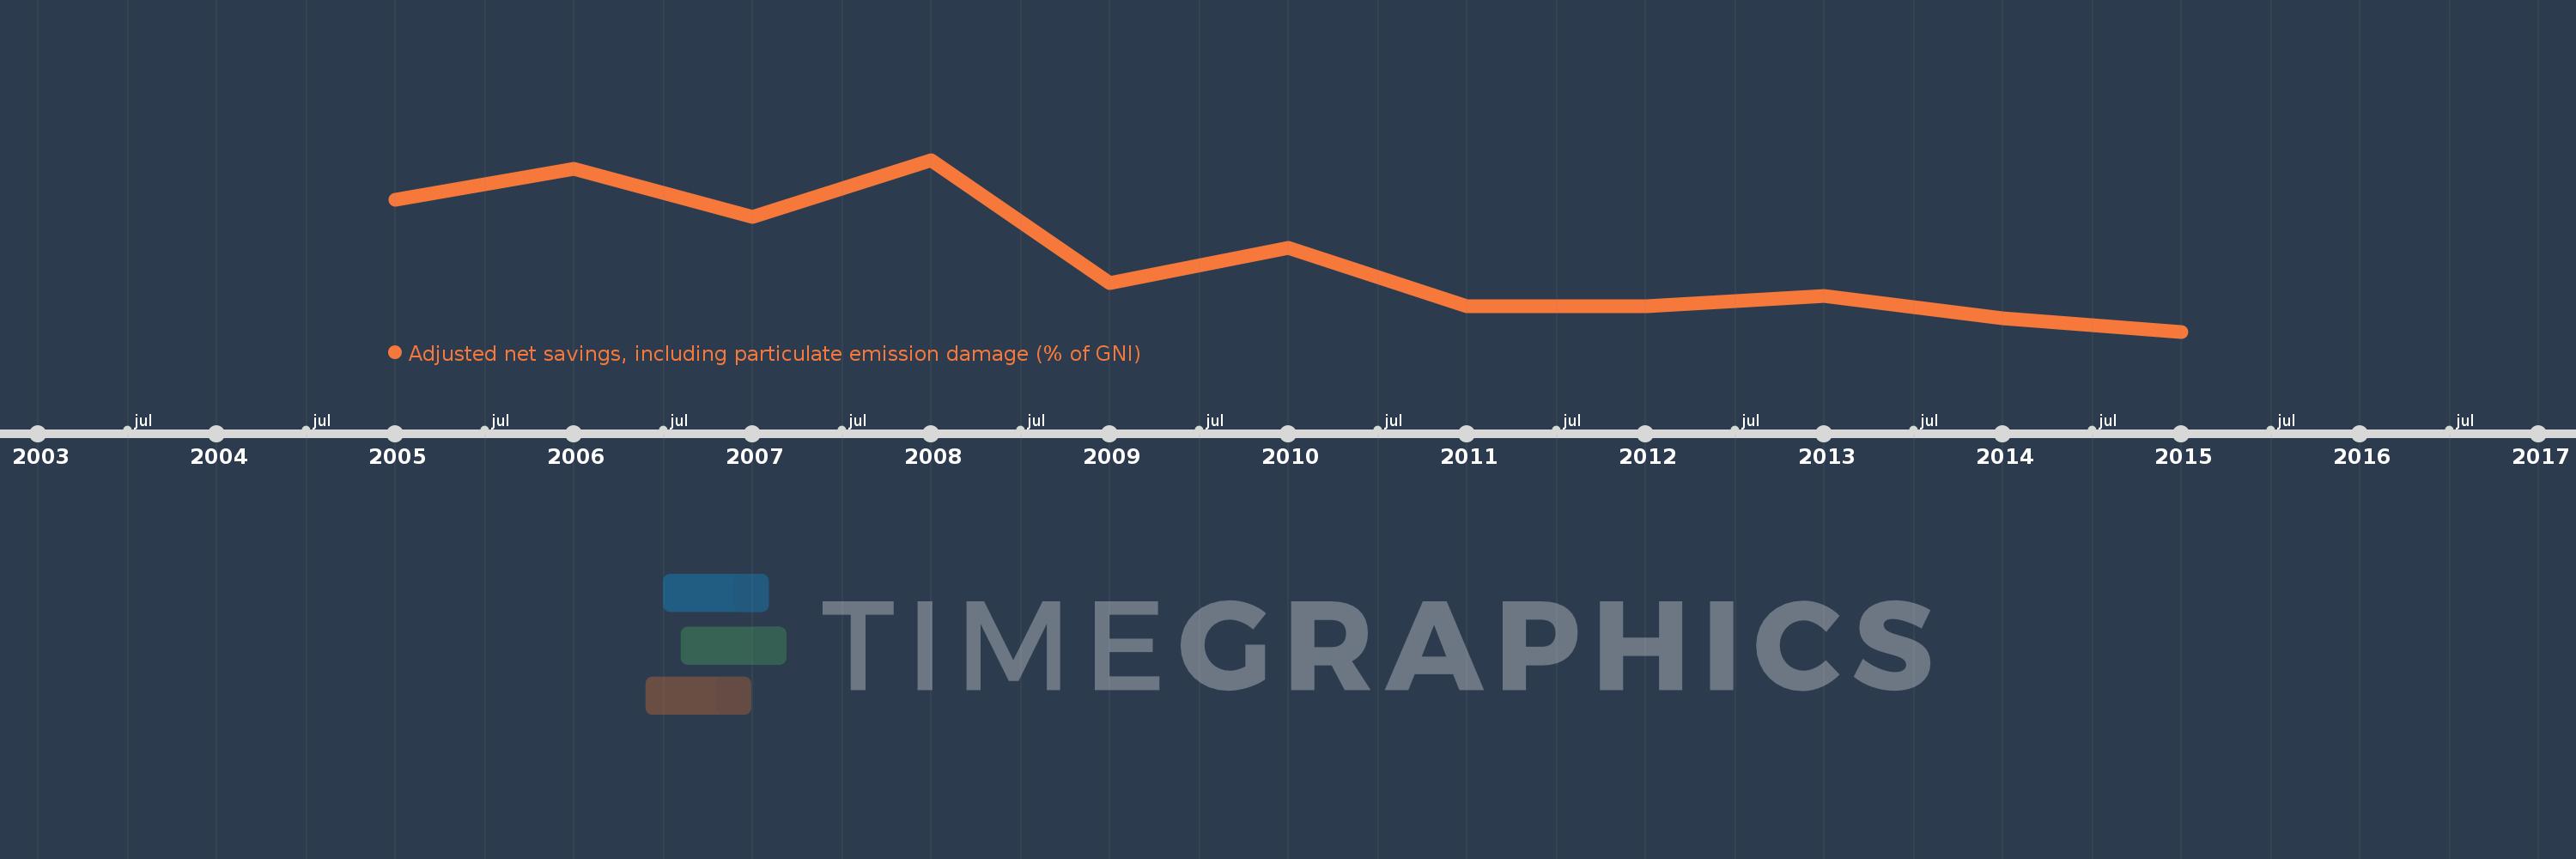
This timeline shows a graph from 2005 to 2015 of Haiti. No data until 2004. Number of actual observations by date: 11.
Source name:
World Development Indicators
Source organization:
World Bank staff estimates based on sources and methods in World Bank's "The Changing Wealth of Nations: Measuring Sustainable Development in the New Millennium" (2011).
Categories, topics:
Economy & Growth, Environment
Last updated:
apr 23, 2017
Indicators value changes by year
Meaning:
20.687
Minimum:
16.567
jan 1, 2015
Maximum:
26.146
jan 1, 2008
At the date of observation
Value
Absolute change
Change from the previous value
jan 1, 2005
23.928
+23.928
0.0%
jan 1, 2006
25.65
+1.722
7.2%
jan 1, 2007
22.962
-2.688
-10.48%
jan 1, 2008
26.146
+3.184
13.87%
jan 1, 2009
19.287
-6.859
-26.23%
jan 1, 2010
21.226
+1.938
10.05%
jan 1, 2011
17.959
-3.267
-15.39%
jan 1, 2012
17.957
-0.001
-0.01%
jan 1, 2013
18.577
+0.62
3.45%
jan 1, 2014
17.301
-1.276
-6.87%
jan 1, 2015
16.567
-0.733
-4.24%
Ranking of countries by current statistics by years