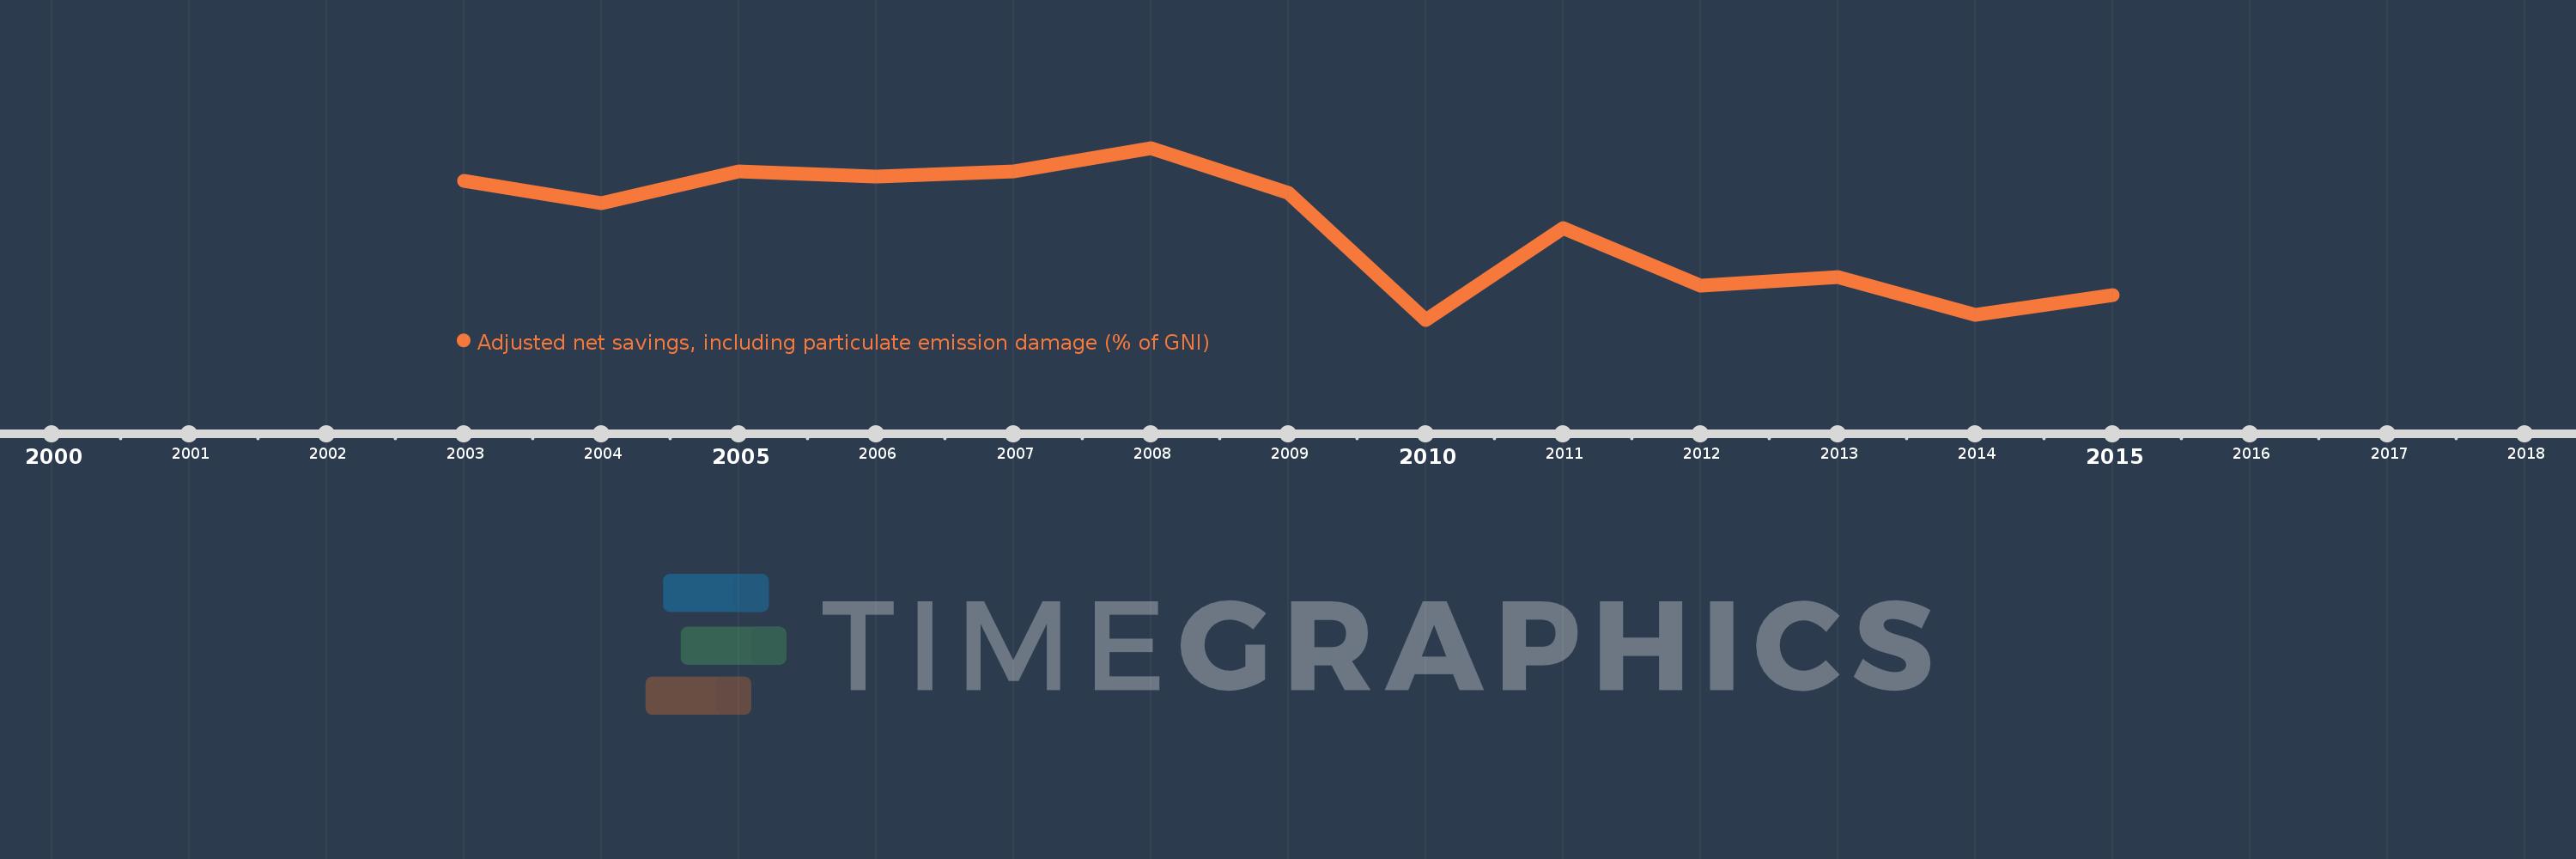
This timeline shows a graph from 2003 to 2015 of Belgium. No data until 2002. Number of actual observations by date: 13.
Source name:
World Development Indicators
Source organization:
World Bank staff estimates based on sources and methods in World Bank's "The Changing Wealth of Nations: Measuring Sustainable Development in the New Millennium" (2011).
Categories, topics:
Economy & Growth, Environment
Last updated:
apr 23, 2017
Indicators value changes by year
Meaning:
12.282
Minimum:
8.829
jan 1, 2010
Maximum:
15.299
jan 1, 2008
At the date of observation
Value
Absolute change
Change from the previous value
jan 1, 2003
14.074
+14.074
0.0%
jan 1, 2004
13.228
-0.846
-6.01%
jan 1, 2005
14.424
+1.196
9.04%
jan 1, 2006
14.213
-0.211
-1.46%
jan 1, 2007
14.432
+0.219
1.54%
jan 1, 2008
15.299
+0.867
6.01%
jan 1, 2009
13.592
-1.707
-11.16%
jan 1, 2010
8.829
-4.763
-35.05%
jan 1, 2011
12.267
+3.439
38.95%
jan 1, 2012
10.111
-2.156
-17.57%
jan 1, 2013
10.423
+0.312
3.08%
jan 1, 2014
9.0
-1.423
-13.65%
jan 1, 2015
9.771
+0.77
8.56%
Ranking of countries by current statistics by years