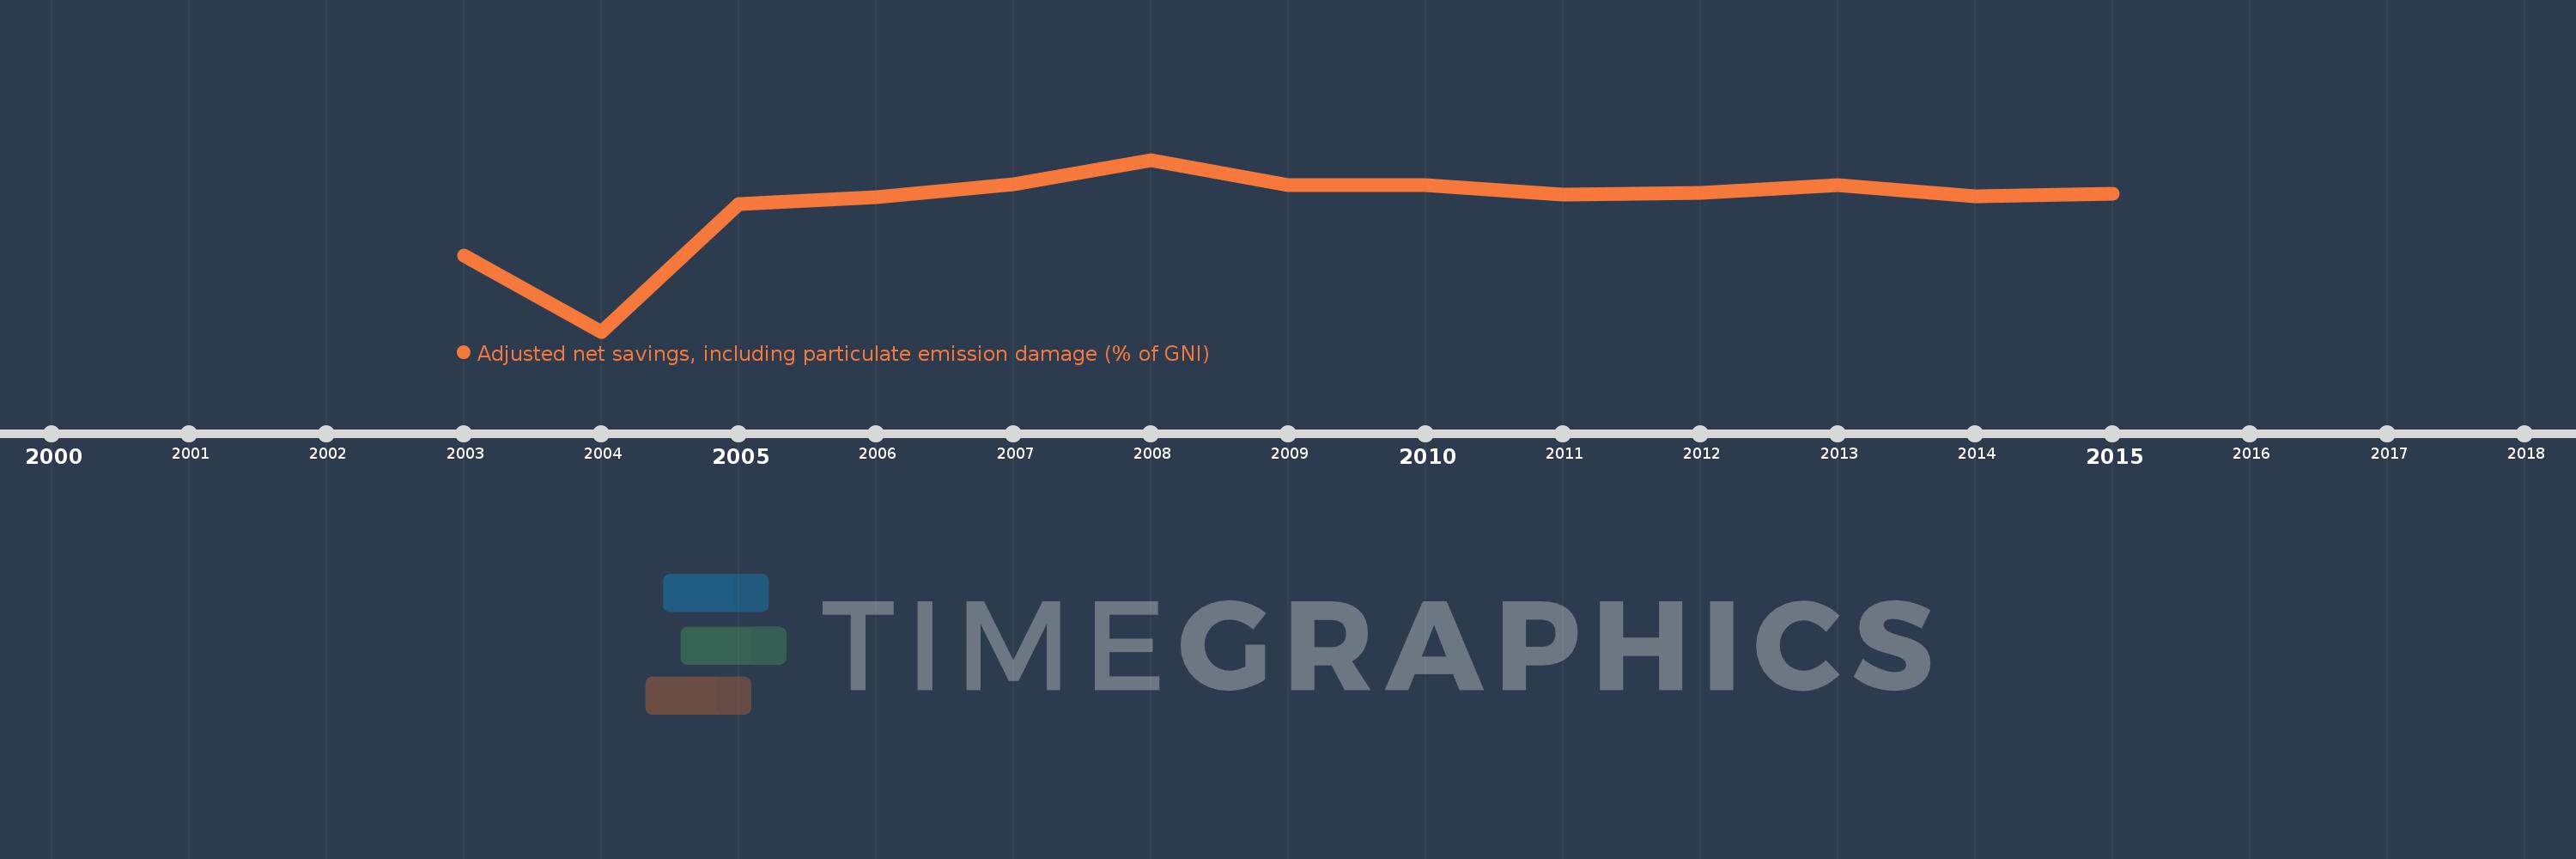
This timeline shows a graph from 2003 to 2015 of Lebanon. No data until 2002. Number of actual observations by date: 13.
Source name:
World Development Indicators
Source organization:
World Bank staff estimates based on sources and methods in World Bank's "The Changing Wealth of Nations: Measuring Sustainable Development in the New Millennium" (2011).
Categories, topics:
Economy & Growth, Environment
Last updated:
apr 23, 2017
Indicators value changes by year
Meaning:
-10.259
Minimum:
-40.259
jan 1, 2004
Maximum:
0.438
jan 1, 2008
At the date of observation
Value
Absolute change
Change from the previous value
jan 1, 2003
-22.178
-22.178
0.0%
jan 1, 2004
-40.259
-18.08
81.52%
jan 1, 2005
-10.014
+30.245
-75.13%
jan 1, 2006
-8.511
+1.503
-15.01%
jan 1, 2007
-5.323
+3.188
-37.46%
jan 1, 2008
0.438
+5.761
-108.23%
jan 1, 2009
-5.493
-5.931
-1.35K%
jan 1, 2010
-5.577
-0.084
1.54%
jan 1, 2011
-7.733
-2.155
38.65%
jan 1, 2012
-7.334
+0.399
-5.16%
jan 1, 2013
-5.606
+1.728
-23.56%
jan 1, 2014
-8.134
-2.529
45.11%
jan 1, 2015
-7.65
+0.484
-5.95%
Ranking of countries by current statistics by years