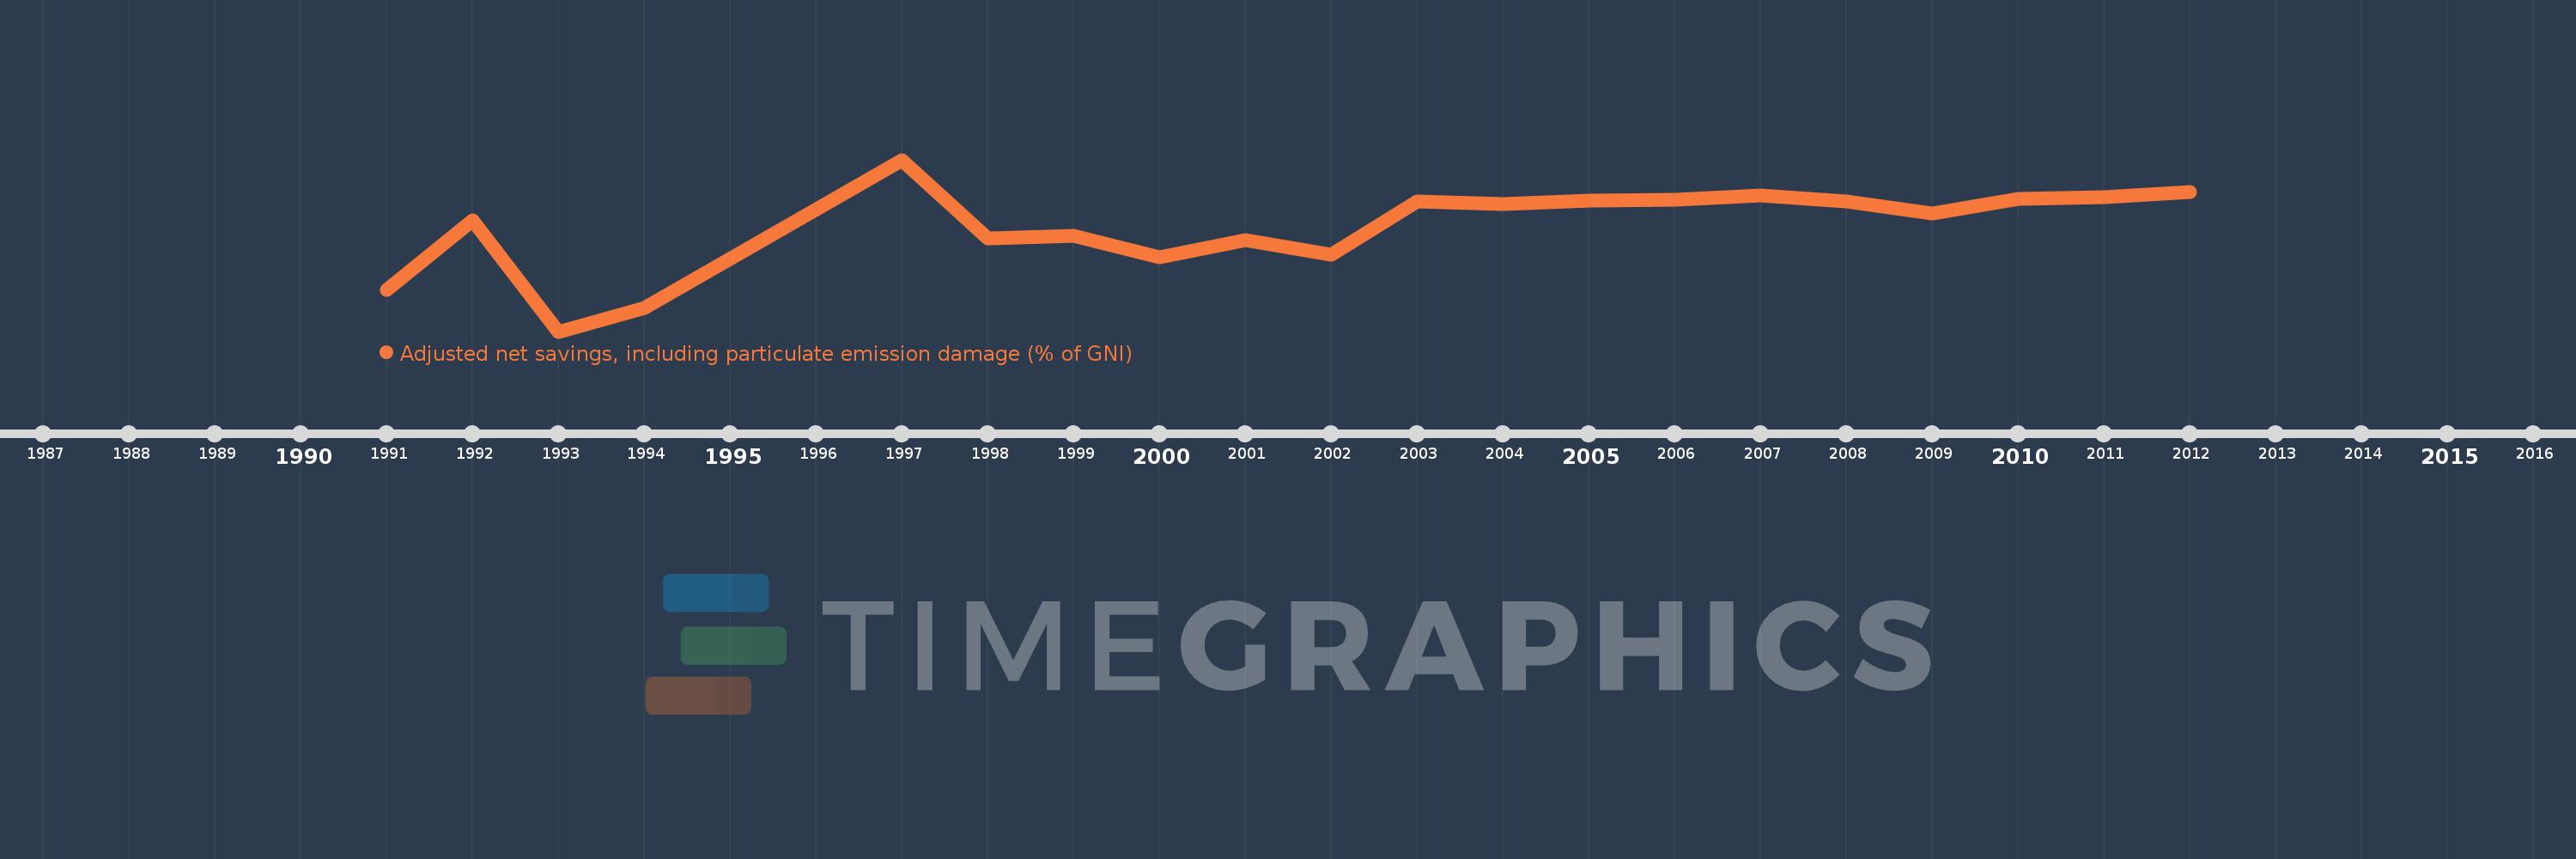
This timeline shows a graph from 1991 to 2012 of Angola. No data until 1990. Number of actual observations by date: 20.
Source name:
World Development Indicators
Source organization:
World Bank staff estimates based on sources and methods in World Bank's "The Changing Wealth of Nations: Measuring Sustainable Development in the New Millennium" (2011).
Categories, topics:
Economy & Growth, Environment
Last updated:
apr 23, 2017
Indicators value changes by year
Meaning:
-33.374
Minimum:
-142.782
jan 1, 1993
Maximum:
36.999
jan 1, 1997
At the date of observation
Value
Absolute change
Change from the previous value
jan 1, 1991
-99.32
-99.32
0.0%
jan 1, 1992
-26.269
+73.051
-73.55%
jan 1, 1993
-142.782
-116.513
443.54%
jan 1, 1994
-117.824
+24.958
-17.48%
jan 1, 1997
36.999
+154.823
-131.4%
jan 1, 1998
-45.198
-82.197
-222.16%
jan 1, 1999
-42.11
+3.087
-6.83%
jan 1, 2000
-65.282
-23.171
55.03%
jan 1, 2001
-46.645
+18.636
-28.55%
jan 1, 2002
-61.985
-15.34
32.89%
jan 1, 2003
-6.596
+55.389
-89.36%
jan 1, 2004
-9.507
-2.911
44.14%
jan 1, 2005
-5.832
+3.675
-38.66%
jan 1, 2006
-4.841
+0.991
-17.0%
jan 1, 2007
-0.586
+4.255
-87.9%
jan 1, 2008
-6.597
-6.011
1.03K%
jan 1, 2009
-19.333
-12.736
193.06%
jan 1, 2010
-4.341
+14.992
-77.55%
jan 1, 2011
-2.408
+1.933
-44.52%
jan 1, 2012
2.967
+5.375
-223.21%
Ranking of countries by current statistics by years