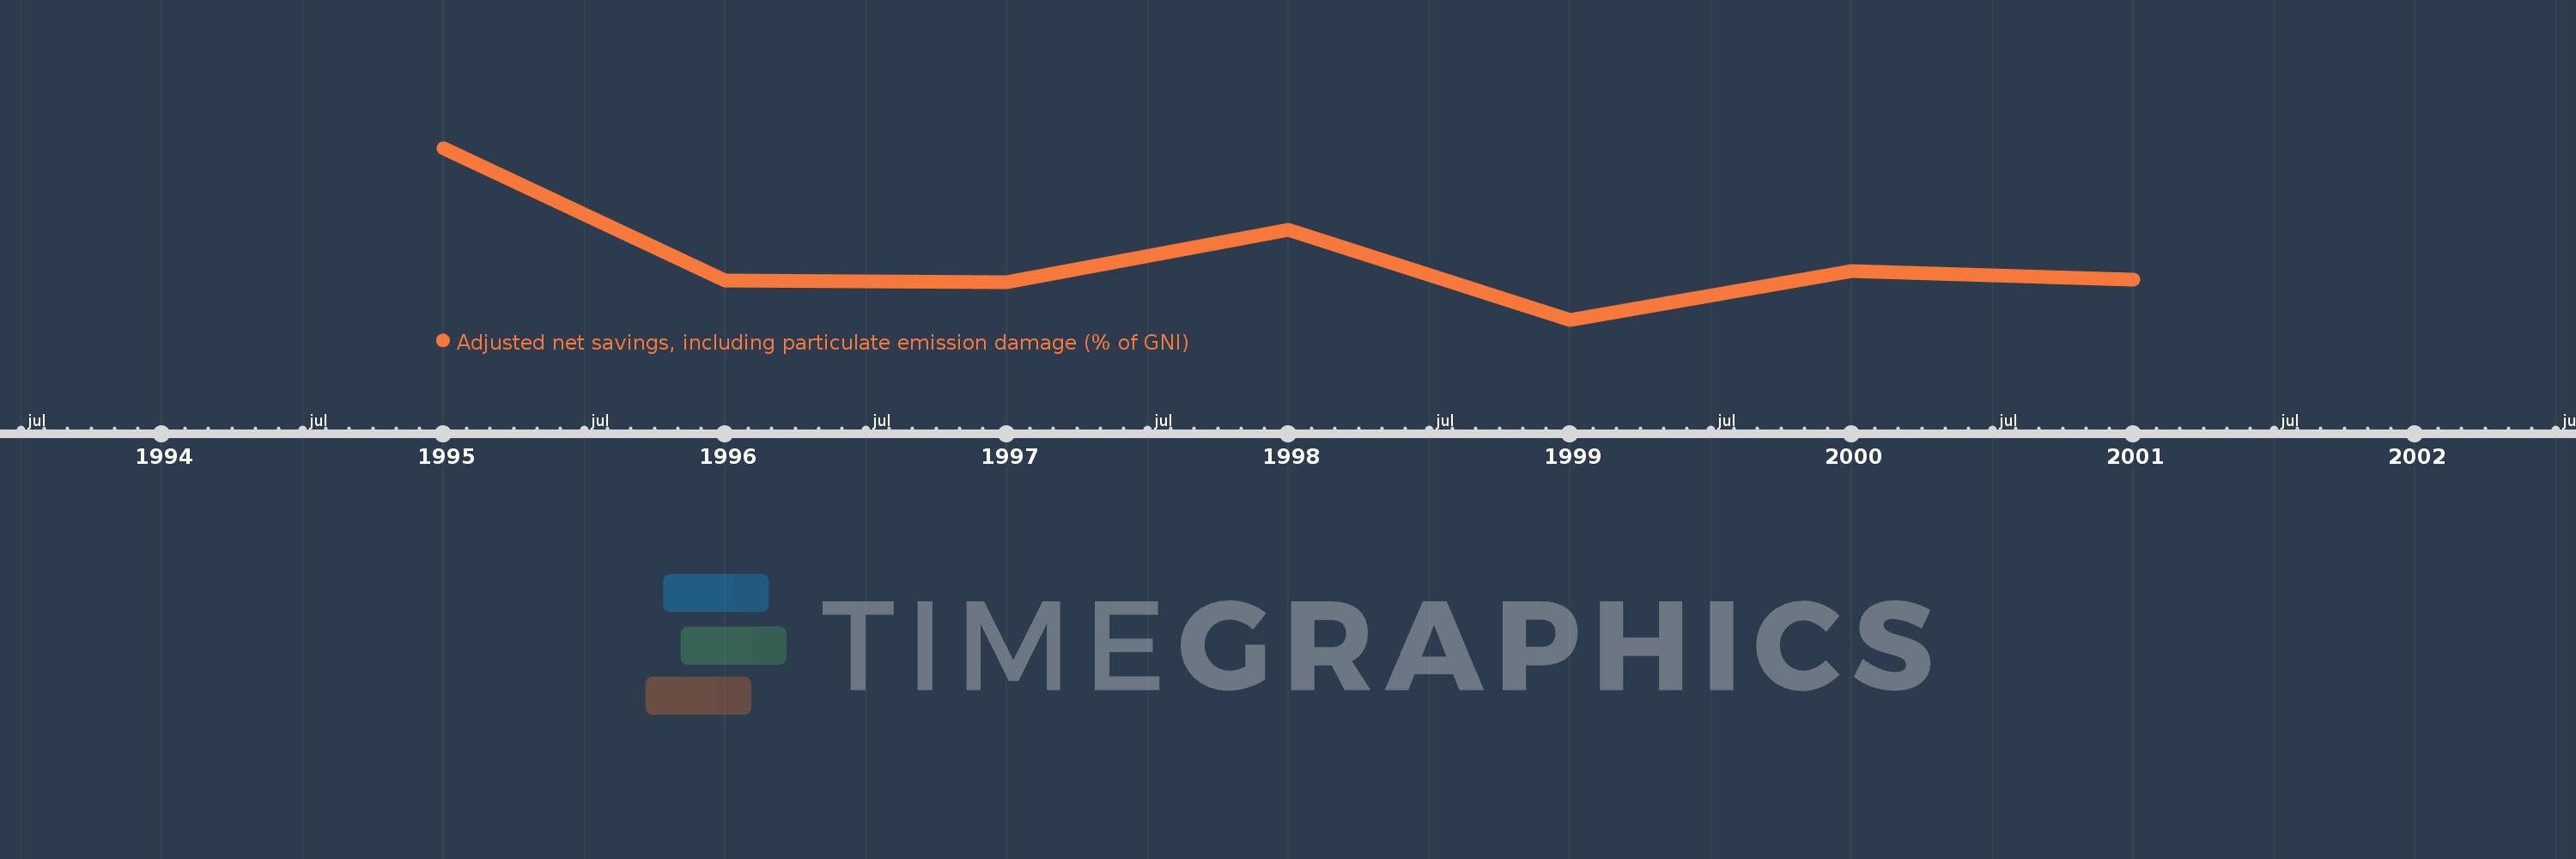
This timeline shows a graph from 1995 to 2001 of Eritrea. No data until 1994. Number of actual observations by date: 7.
Source name:
World Development Indicators
Source organization:
World Bank staff estimates based on sources and methods in World Bank's "The Changing Wealth of Nations: Measuring Sustainable Development in the New Millennium" (2011).
Categories, topics:
Economy & Growth, Environment
Last updated:
apr 23, 2017
Indicators value changes by year
Meaning:
8.347
Minimum:
-9.116
jan 1, 1999
Maximum:
40.01
jan 1, 1995
At the date of observation
Value
Absolute change
Change from the previous value
jan 1, 1995
40.01
+40.01
0.0%
jan 1, 1996
2.058
-37.952
-94.86%
jan 1, 1997
1.679
-0.378
-18.38%
jan 1, 1998
16.538
+14.858
884.79%
jan 1, 1999
-9.116
-25.653
-155.12%
jan 1, 2000
4.894
+14.01
-153.69%
jan 1, 2001
2.369
-2.526
-51.61%
Ranking of countries by current statistics by years