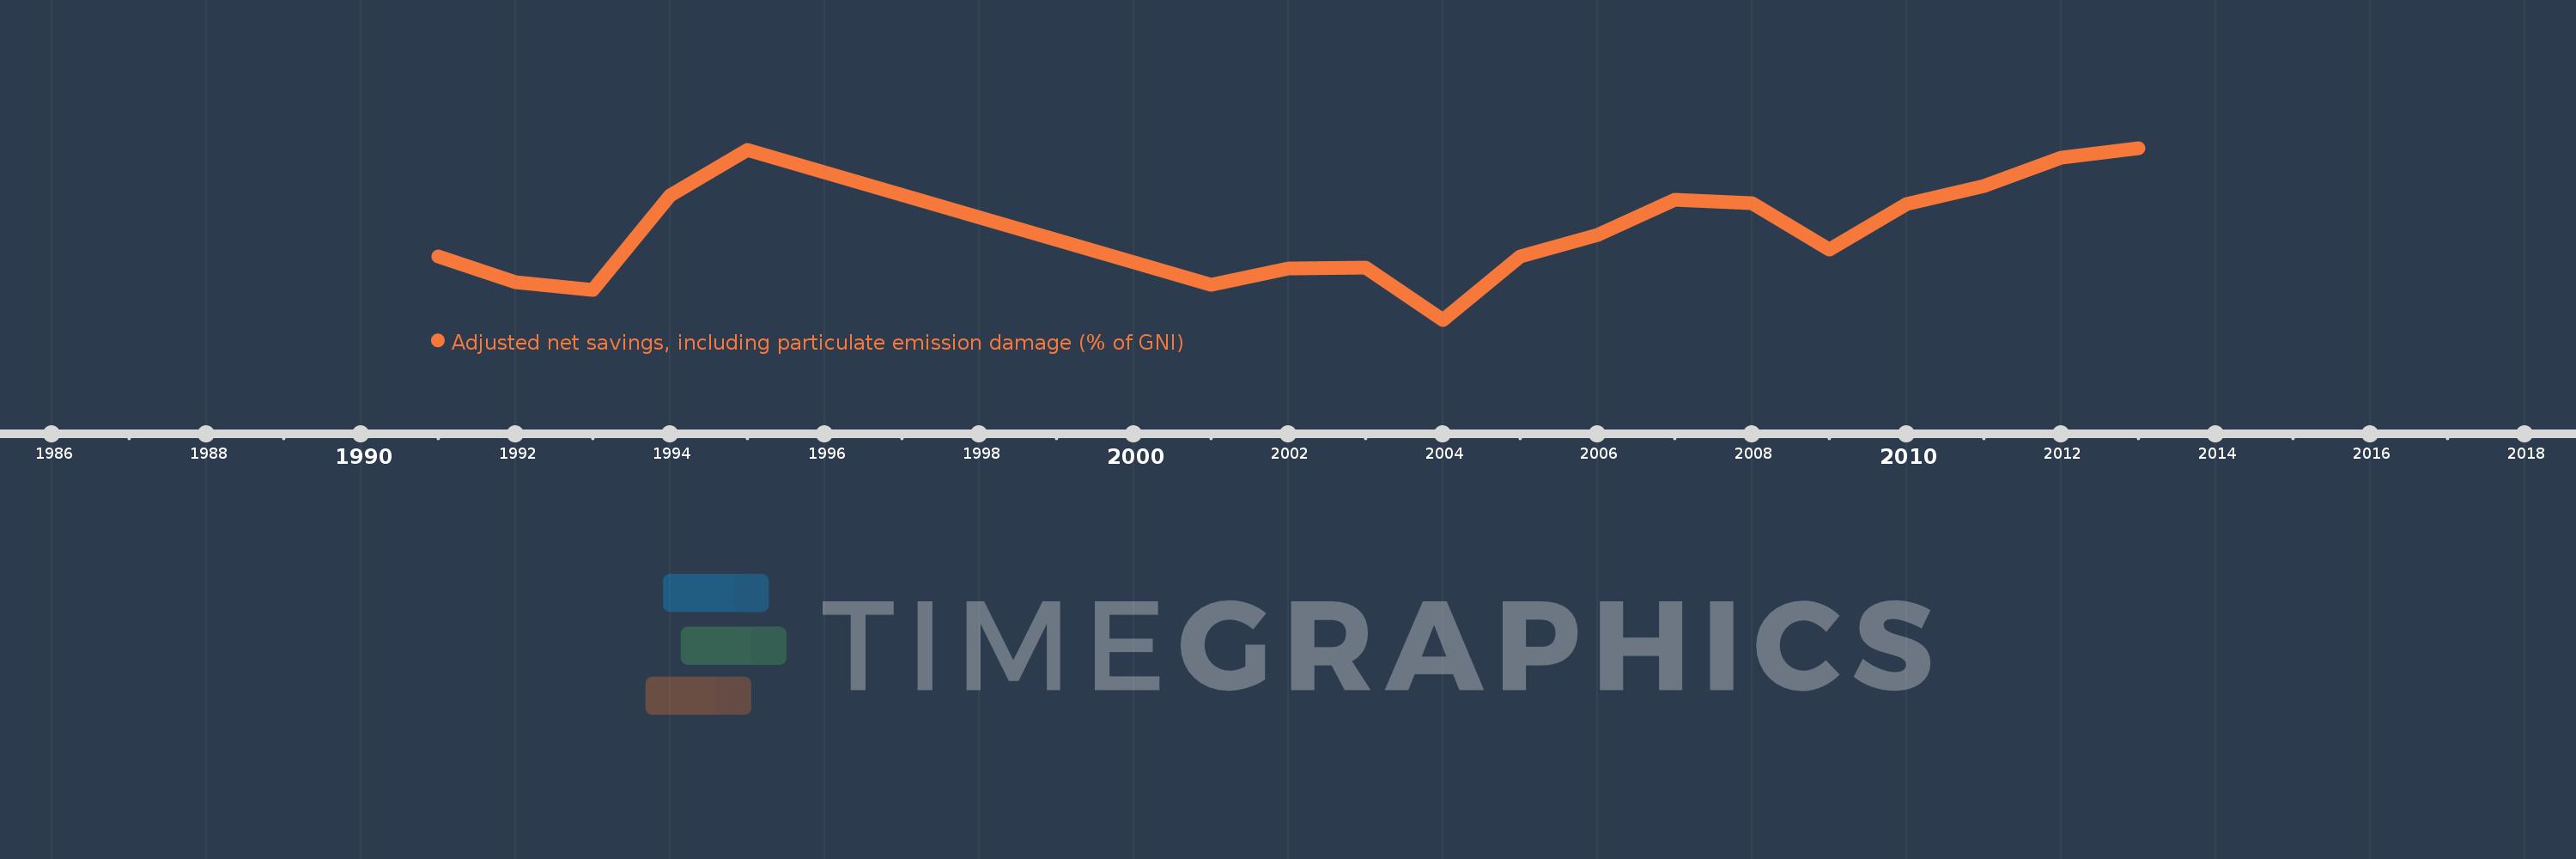
This timeline shows a graph from 1991 to 2013 of Low income. No data until 1990. Number of actual observations by date: 18.
Source name:
World Development Indicators
Source organization:
World Bank staff estimates based on sources and methods in World Bank's "The Changing Wealth of Nations: Measuring Sustainable Development in the New Millennium" (2011).
Categories, topics:
Economy & Growth, Environment
Last updated:
apr 23, 2017
Indicators value changes by year
Meaning:
1.342
Minimum:
-1.206
jan 1, 2004
Maximum:
3.717
jan 1, 2013
At the date of observation
Value
Absolute change
Change from the previous value
jan 1, 1991
0.614
+0.614
0.0%
jan 1, 1992
-0.131
-0.745
-121.28%
jan 1, 1993
-0.359
-0.228
174.9%
jan 1, 1994
2.359
+2.718
-756.98%
jan 1, 1995
3.656
+1.297
54.97%
jan 1, 2001
-0.207
-3.863
-105.66%
jan 1, 2002
0.264
+0.471
-227.52%
jan 1, 2003
0.297
+0.033
12.32%
jan 1, 2004
-1.206
-1.503
-506.73%
jan 1, 2005
0.613
+1.819
-150.8%
jan 1, 2006
1.235
+0.622
101.56%
jan 1, 2007
2.223
+0.988
79.98%
jan 1, 2008
2.122
-0.101
-4.56%
jan 1, 2009
0.806
-1.315
-61.99%
jan 1, 2010
2.099
+1.293
160.29%
jan 1, 2011
2.62
+0.521
24.81%
jan 1, 2012
3.439
+0.819
31.27%
jan 1, 2013
3.717
+0.277
8.07%
Ranking of countries by current statistics by years