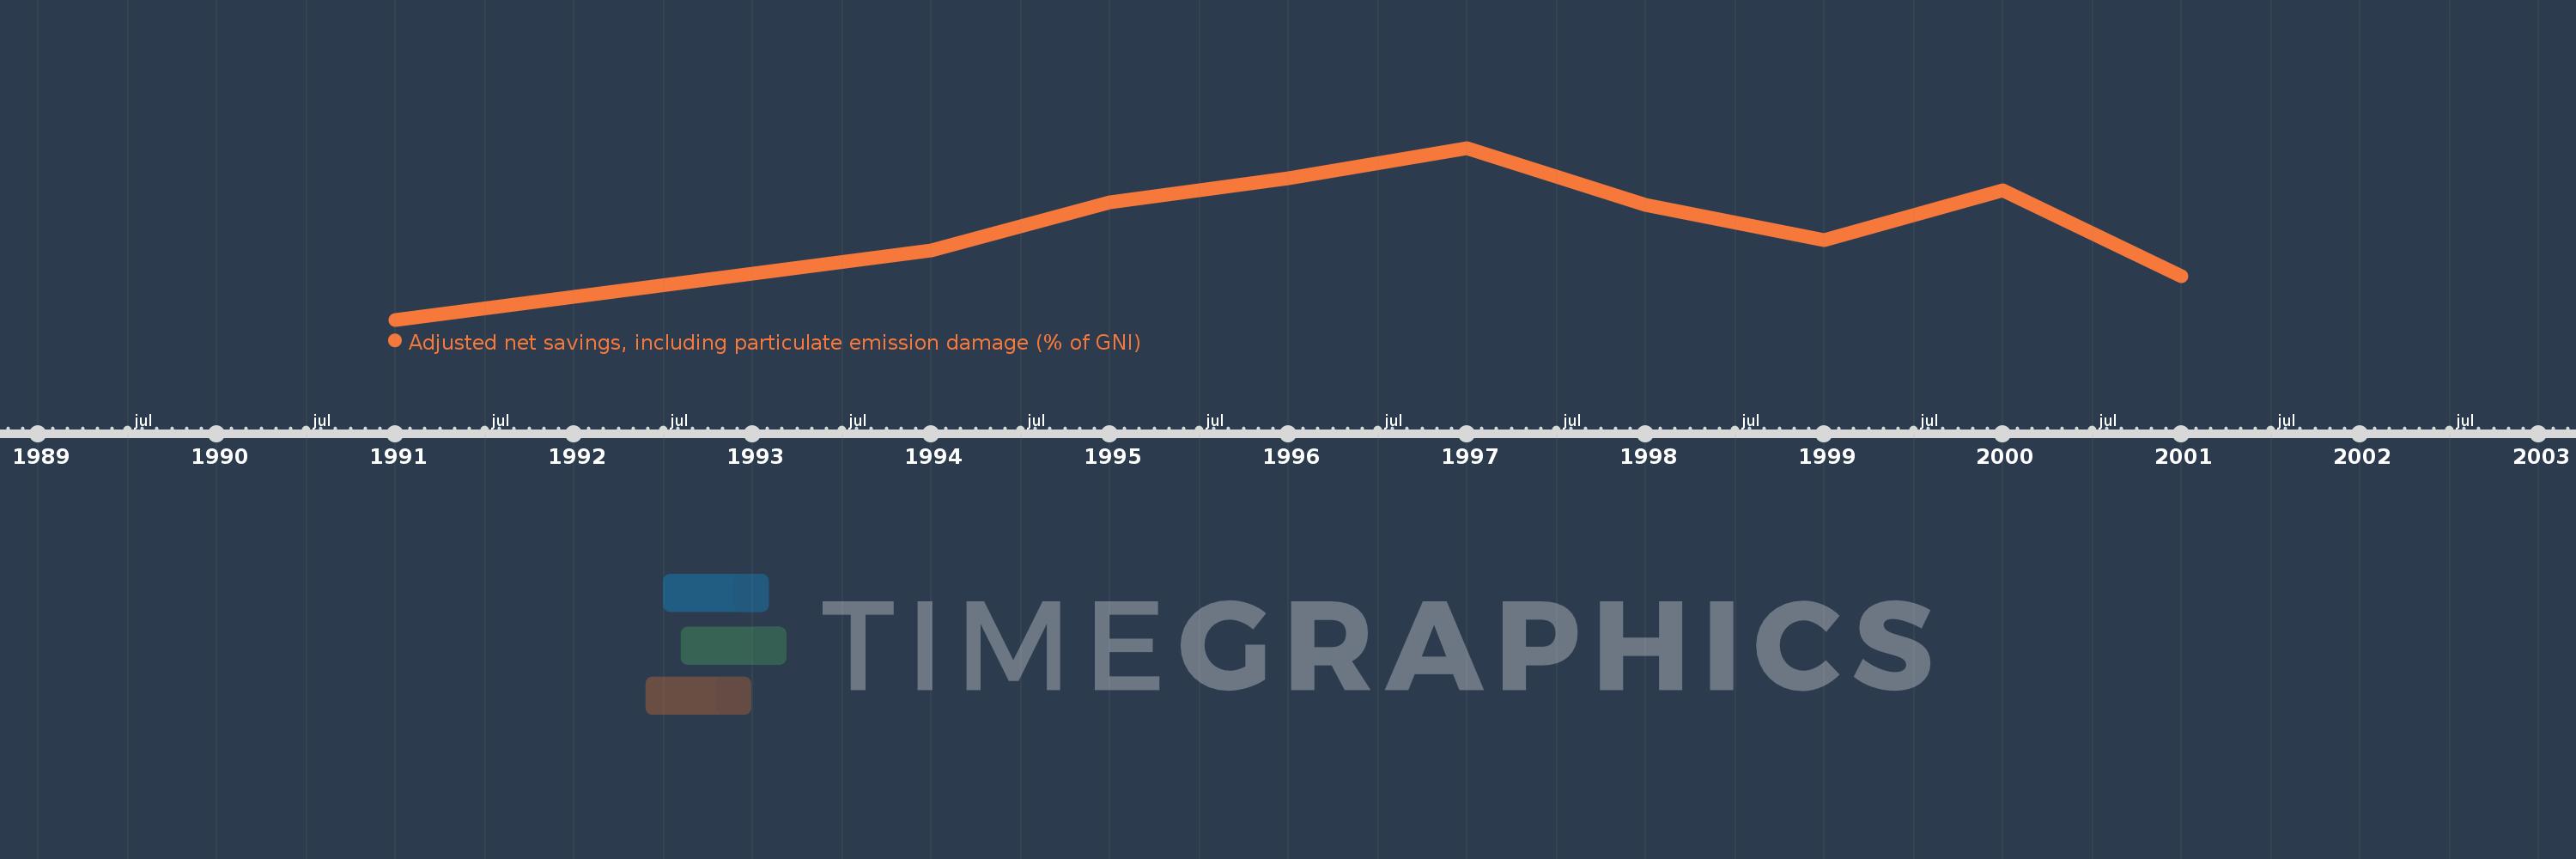
This timeline shows a graph from 1991 to 2001 of Iran, Islamic Rep.. No data until 1990. Number of actual observations by date: 9.
Source name:
World Development Indicators
Source organization:
World Bank staff estimates based on sources and methods in World Bank's "The Changing Wealth of Nations: Measuring Sustainable Development in the New Millennium" (2011).
Categories, topics:
Economy & Growth, Environment
Last updated:
apr 23, 2017
Indicators value changes by year
Meaning:
11.952
Minimum:
4.362
jan 1, 1991
Maximum:
17.871
jan 1, 1997
At the date of observation
Value
Absolute change
Change from the previous value
jan 1, 1991
4.362
+4.362
0.0%
jan 1, 1994
9.811
+5.449
124.91%
jan 1, 1995
13.587
+3.776
38.49%
jan 1, 1996
15.52
+1.933
14.23%
jan 1, 1997
17.871
+2.351
15.15%
jan 1, 1998
13.38
-4.491
-25.13%
jan 1, 1999
10.655
-2.725
-20.37%
jan 1, 2000
14.566
+3.912
36.71%
jan 1, 2001
7.815
-6.751
-46.35%
Ranking of countries by current statistics by years